StatementSolutions
-
Posts
60 -
Joined
-
Last visited
-
Days Won
1
Content Type
Profiles
Forums
Events
Everything posted by StatementSolutions
-
Tooltip when hovering an area of the chart
StatementSolutions replied to StatementSolutions's question in General Questions
I want to get the tooltip to appear on top of the jChartFX pie chart not behind it. I created a draggable and resizeable widget. It seems that the tooltip appears behind the page where I have the jChartFx pie chart at.. Code: @model ePortfolio.Models.WidgetViewModel @using System.Web.Script.Serialization; <div class="widget-head" style="display:block;overflow:no-content;height:10%;width:100%;"> <div class="widget-title text-center" style="padding-top:10px;"><label>@Model.Widget.Title</label></div> <div id="id-refresh-@Model.Widget.Id" class="wdgbkg"> </div> @*<div id="header"> <table class="tablesorter" border="0" cellpadding="0" cellspacing="1" width="100%" height="100%"> <tr> <th class="wdgcenter" style="width:50px">Qty/Shares</th> <th class="wdgcenter" style="width:50px">Account #</th> <th class="wdgcenter" style="width:50px">% of Portfolio</th> </tr> </table> </div>*@ </div> <div class="widget-body" style="display:block;overflow:auto;height:90%;width:100%;"> <div class="widget-content" id="ChartDiv" style="overflow: auto;height:100%;width:100%;"></div> </div> <script type="text/javascript" language="javascript"> var chart@(Model.Widget.Id); function LoadPieChart() { chart@(Model.Widget.Id) = new cfx.Chart(); chart@(Model.Widget.Id).setGallery(cfx.Gallery.Pie); chart@(Model.Widget.Id).getAllSeries().getPointLabels().setVisible(true); var pieAttr = chart@(Model.Widget.Id).getAllSeries().getGalleryAttributes(); pieAttr.setLabelsInside(true); //chart@(Model.Widget.Id).getAllSeries().getPointLabels().setFormat("%l %p%%"); chart@(Model.Widget.Id).getAllSeries().getPointLabels().setFormat("%p%%"); var str = @Html.Raw(Json.Encode(ViewData["Asset Allocations Chart"])); chart@(Model.Widget.Id).getAxisY().getDataFormat().setDecimals(2); chart@(Model.Widget.Id).getView3D().setEnabled(true); chart@(Model.Widget.Id).getAllSeries().getPointLabels().setVisible(true); chart@(Model.Widget.Id).setDataSource(str); var data = chart@(Model.Widget.Id).getData(); data.setSeries(1); data.setPoints(10); chart@(Model.Widget.Id).getToolTips().setEnabled(true); chart@(Model.Widget.Id).getToolTips().setFormat("%l%"); //chart@(Model.Widget.Id).getAllSeries().getPointLabels().setVisible(true); //chart@(Model.Widget.Id).getAllSeries().getPointLabels().setAlignment(cfx.StringAlignment.NEAR); chart@(Model.Widget.Id).getLegendBox().setVisible(true); chart@(Model.Widget.Id).getLegendBox().setWidth(175); chart@(Model.Widget.Id).getLegendBox().setDock(cfx.DockArea.Right); chart@(Model.Widget.Id).getLegendBox().setContentLayout(cfx.ContentLayout.Near); @*chart@(Model.Widget.Id).getPlotAreaMargin().setTop(0); chart@(Model.Widget.Id).getPlotAreaMargin().setBottom(0); chart@(Model.Widget.Id).getPlotAreaMargin().setRight(0); chart@(Model.Widget.Id).getPlotAreaMargin().setLeft(0);*@ var divHolder = document.getElementById('ChartDiv'); chart@(Model.Widget.Id).create(divHolder); } $(function() { LoadPieChart(); }); //$(window).resize(function() { function ResizeChart() { if (chart@(Model.Widget.Id) != null) chart@(Model.Widget.Id).doUpdate(true); }; </script> -
Tooltip when hovering an area of the chart
StatementSolutions replied to StatementSolutions's question in General Questions
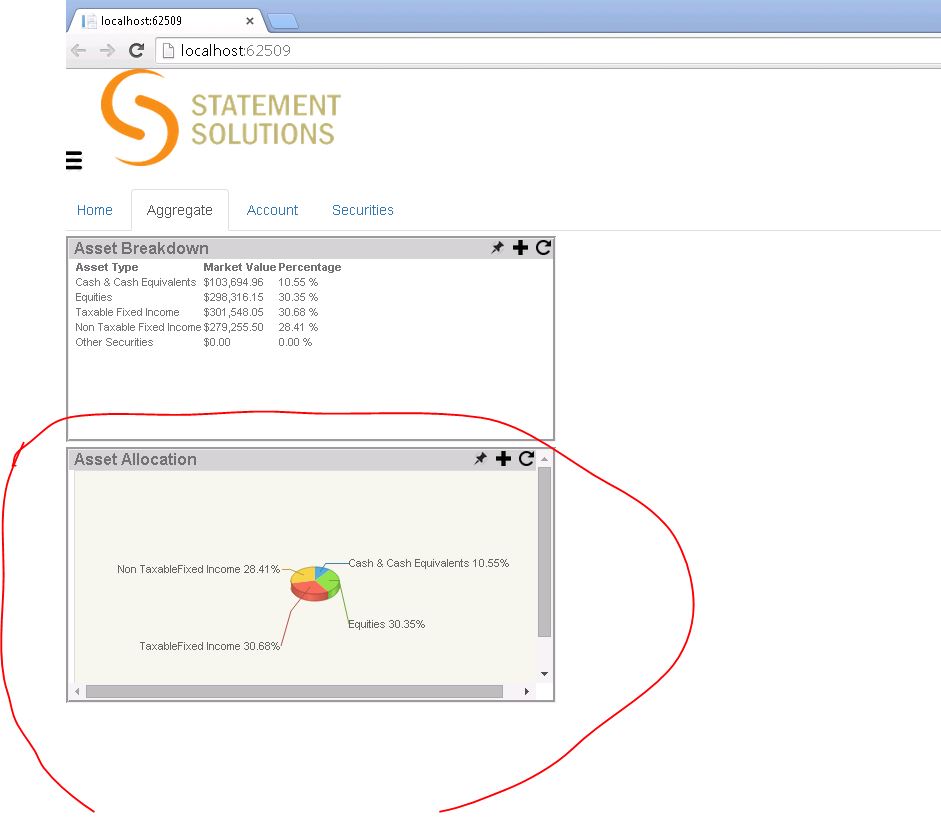
I can't attach an image of the website with the jChartFx pie chart which I want to add a tooltip. This JChartFx pie chart is on a widget that is draggable and resizeable. I should be able to hoveer the mouse over an area of the jChartFx pie chart and the tooltip should appear but it seems that the tooltip is appearing behind the widget. -
Tooltip when hovering an area of the chart
StatementSolutions replied to StatementSolutions's question in General Questions
View Page Source: <!DOCTYPE html> <!--[if lt IE 7]> <html class="no-js lt-ie9 lt-ie8 lt-ie7"> <![endif]--> <!--[if IE 7]> <html class="no-js lt-ie9 lt-ie8"> <![endif]--> <!--[if IE 8]> <html class="no-js lt-ie9"> <![endif]--> <!--[if gt IE 8]><!--> <html class="no-js"> <!--<![endif]--> <head> <meta charset="utf-8" /> <meta http-equiv="X-UA-Compatible" content="IE=edge;chrome=1"> <meta name="viewport" content="width=device-width, initial-scale=1.0"> <title> - ePortfolio Manager</title> <link href='//fonts.googleapis.com/css?family=Open+Sans+Condensed:300,300italic,700&subset=latin,cyrillic-ext,latin-ext,cyrillic' rel='stylesheet' type='text/css'> <link rel="stylesheet" href="//netdna.bootstrapcdn.com/font-awesome/4.0.1/css/font-awesome.min.css"> <link rel="stylesheet" type="text/css" href="/Content/jChartfx/Attributes/jchartfx.attributes.css" /> <link rel="stylesheet" type="text/css" href="/Content/jChartfx/Palettes/jchartfx.palette.css" /> <link href="/Content/gridster/app.css" rel="stylesheet"/> <link href="/Content/gridster/jquery.gridster.css" rel="stylesheet"/> <style> .gridster * { -moz-box-sizing: border-box; -webkit-box-sizing: border-box; box-sizing: border-box; /* Border boxing is used, so the padding, margin and borders are within the width and height of de element. */ color: rgb(112, 112, 112); font-family: Arial; font-size: 11px; margin: 0; /* Margin zero is used to prevent unnecessary white space. */ padding: 0; /* Padding zero is used to prevent unnecessary white space. */ } </style> <link href="/Content/jquery.multilevelpushmenu.css" rel="stylesheet"/> <link href="/Content/bootstrap_integration.css" rel="stylesheet"/> <link href="/Content/bootstrap.css" rel="stylesheet"/> <link href="/Content/bootstrap-theme.css" rel="stylesheet"/> <link href="/Content/site.css" rel="stylesheet"/> <script src="/Scripts/modernizr-2.6.2.js"></script> <script src="/Scripts/jquery-1.10.2.js"></script> <script src="/Scripts/bootstrap.js"></script> <script src="/Scripts/respond.js"></script> <script src="/Scripts/bootstrap-paginator.js"></script> <script src="/Scripts/jChartFx/jchartfx.system.js"></script> <script src="/Scripts/jChartFx/jchartfx.coreBasic.js"></script> </head> <body> <!--[if lt IE 7]> <p class="browsehappy">You are using an <strong>outdated</strong> browser. Please <a href="//browsehappy.com/">upgrade your browser</a> to improve your experience.</p> <![endif]--> <div class="container"> <div id="bodyDiv"> <div class="row"> <div class="col-lg-12 col-md-12 col-sm-12 col-xs-12"> <div id="pushobj"> <div class="navbar-header" style="height:100px"> <div class="navbar-brand" style="padding-left: 30px; padding-top: 5px;"> <a class="site-title" href="/"> <img src="/Content/unensjg2.ooq.jpg" alt="Logo" style="height: 90px;"> </a> <span class="site-desc"></span> </div> </div> <div class="navbar-collapse collapse"> <form action="/Account/LogOff" class="navbar-right" id="logoutForm" method="post"><input name="__RequestVerificationToken" type="hidden" value="iti9p8tgcfZUcbpg9hveUqKEDmvZ_rqB1JLtgImHZ3uoU1JlzTqik5jMYTgDiZ3Z71DLOEqX0_9IjJM9n85dCYtBDBps1EWAXLcbhtdeSjGjMhfTEhuI9l5Jjz7X2QBMFKNkylOj9NJaSEf6oRemnA2" /> <ul class="nav navbar-nav navbar-right"> <li> <a href="/Manage" title="Manage">Hello wleung!</a> </li> <li> <a href="javascript:document.getElementById('logoutForm').submit()">Log off</a> </li> </ul> </form> </div> <div class="body-content"> <ul class="nav nav-tabs"> <li class=""><a href="/Dashboard">HOME</a></li> <li class="active"><a href="/Dashboard/Aggregate/240">AGGREGATE</a></li> <li class="disabledTab"><a href="/Dashboard/Account">ACCOUNT</a></li> <li class="disabledTab"><a href="/Dashboard/Security">SECURITIES</a></li> </ul> <div class="container tab-content"> <div style="text-align: center;vertical-align:middle; width: 100%;"> <br /> <b><span>Title: Steel, Joan </span></b> </div> <div style="position: relative;height: 100%; width: 100%;"> <div id="columns" class="gridster ready"> <ul style="position: relative;height: 100%; width: 100%;"> <li data-row="1" data-col="4" data-sizex="3" data-sizey="2" id="3" style="border:1px solid;"> <div class="widget-head" style="display:block;overflow:no-content;height:10%;width:100%;"> <div class="widget-title text-center" style="padding-top:10px;"><label>ASSET BREAKDOWN</label></div> <div id="id-refresh-3" class="wdgbkg"> </div> <div id="header"> <table class="tablesorter" border="0" cellpadding="0" cellspacing="1" width="100%" height="100%"> <tr> <th class="wdglabel" style="width:65px">Account #</th> <th class="wdgcenter" style="width:150px">Cash &<br/>Cash Equivalents</th> <th class="wdgcenter" style="width:65px">Equities</th> <th class="wdgcenter" style="width:125px">Taxable<br />Fixed Income</th> <th class="wdgcenter" style="width:150px">Non Taxable<br />Fixed Income</th> <th class="wdgcenter" style="width:65px">Other</th> <th class="wdgcenter" style="width:65px">Total</th> </tr> </table> </div> </div> <br/> <br /> <div class="widget-body" style="display:block;overflow:auto;height:85%;width:100%;"> <div class="widget-content"> <table class="tablesorter" border="0" cellpadding="0" cellspacing="1" width="100%"> <tfoot> <tr> <td class="wdgridge2" colspan="7"></td> </tr> </tfoot> <tbody> <tr> <td class="wdglabel wdgridge" style="width:65px"> <a href="/Dashboard/Account/240?AcctNo=052258649%20%20%20"> 52258649 </a> </td> <td class="wdgnumeric wdgridge" style="width:150px"> $47,210.00 </td> <td class="wdgnumeric wdgridge" style="width:65px"> $87,880.80 </td> <td class="wdgnumeric wdgridge" style="width:125px"> $31,034.10 </td> <td class="wdgnumeric wdgridge" style="width:150px"> $46,609.05 </td> <td class="wdgnumeric wdgridge" style="width:65px"> $0.00 </td> <td class="wdgnumeric" style="width:65px"> $212,733.95 </td> </tr> <tr> <td class="wdglabel wdgridge" style="width:65px"> <a href="/Dashboard/Account/240?AcctNo=086318467%20%20%20"> 86318467 </a> </td> <td class="wdgnumeric wdgridge" style="width:150px"> $20,381.00 </td> <td class="wdgnumeric wdgridge" style="width:65px"> $339,288.99 </td> <td class="wdgnumeric wdgridge" style="width:125px"> $120,312.73 </td> <td class="wdgnumeric wdgridge" style="width:150px"> $50,974.19 </td> <td class="wdgnumeric wdgridge" style="width:65px"> $0.00 </td> <td class="wdgnumeric" style="width:65px"> $530,956.91 </td> </tr> </tbody> </table> </div> </div> </li> <li data-row="1" data-col="1" data-sizex="3" data-sizey="2" id="4" style="border:1px solid;"> <div class="widget-head" style="display:block;overflow:no-content;height:10%;width:100%;"> <div class="widget-title text-center" style="padding-top:10px;"><label>ASSET ALLOCATION</label></div> <div id="id-refresh-4" class="wdgbkg"> </div> </div> <div class="widget-body" style="display:block;overflow:auto;height:90%;width:100%;"> <div class="widget-content" id="ChartDiv" style="overflow: auto;height:100%;width:100%;"></div> </div> <script type="text/javascript" language="javascript"> var chart4; function LoadPieChart() { chart4 = new cfx.Chart(); chart4.setGallery(cfx.Gallery.Pie); chart4.getAllSeries().getPointLabels().setVisible(true); var pieAttr = chart4.getAllSeries().getGalleryAttributes(); pieAttr.setLabelsInside(true); //chart4.getAllSeries().getPointLabels().setFormat("%l %p%%"); chart4.getAllSeries().getPointLabels().setFormat("%p%%"); var str = [{"AssetTypeDesc":"Cash \u0026 Cash Equivalents","EndMarketValue":67591.00},{"AssetTypeDesc":"Equities","EndMarketValue":427169.79},{"AssetTypeDesc":"Taxable Fixed Income","EndMarketValue":151346.83},{"AssetTypeDesc":"Non Taxable Fixed Income","EndMarketValue":97583.24},{"AssetTypeDesc":"Other Securities","EndMarketValue":0.00}]; chart4.getAxisY().getDataFormat().setDecimals(2); chart4.getView3D().setEnabled(true); chart4.getAllSeries().getPointLabels().setVisible(true); chart4.setDataSource(str); var data = chart4.getData(); data.setSeries(1); data.setPoints(10); chart4.getToolTips().setEnabled(true); chart4.getToolTips().setFormat("%l%"); //chart4.getAllSeries().getPointLabels().setVisible(true); //chart4.getAllSeries().getPointLabels().setAlignment(cfx.StringAlignment.NEAR); chart4.getLegendBox().setVisible(true); chart4.getLegendBox().setWidth(175); chart4.getLegendBox().setDock(cfx.DockArea.Right); chart4.getLegendBox().setContentLayout(cfx.ContentLayout.Near); var divHolder = document.getElementById('ChartDiv'); chart4.create(divHolder); } $(function() { LoadPieChart(); }); //$(window).resize(function() { function ResizeChart() { if (chart4 != null) chart4.doUpdate(true); }; </script> </li> </ul> </div> </div> </div> <hr /> <footer> <p>© 2014~2015 - Statement Solutions, LLC.</p> </footer> </div> </div> </div> <div id="menu"> <nav > <h2><i class="fa fa-reorder" ></i>Menu</h2> <ul> <li> <a href="/DashBoard">Dashboard</a> </li> <li> <a href="#"><i class="fa fa-user"></i>Accounts</a> <h2><i class="fa fa-user"></i>Accounts</h2> <ul> <li> <a href="#"><i class="fa fa-wrench"></i>Account Maintenace</a> <h2><i class="fa fa-wrench"></i>Account Maintenace</h2> <ul> <li> <a href="#">General</a> </li> <li> <a href="#">Joint Acct Info</a> </li> <li> <a href="#">Interested Party Info</a> </li> <li> <a href="#">Investment Objectives</a> </li> </ul> </li> <li> <a href="/Aggregates">Aggregates</a> </li> </ul> </li> <li> <a href="#"><i class="fa fa-book"></i>Account Detail</a> <h2><i class="fa fa-book"></i>Account Detail</h2> <ul> <li> <a href="/Transactions">Transactions</a> </li> <li> <a href="/Positions">Positions</a> </li> <li> <a href="/Benchmarks/Yields">Benchmark Yields</a> </li> </ul> </li> <li> <a href="#"><i class="fa fa-paperclip"></i>Reporting</a> <h2><i class="fa fa-paperclip"></i>Reporting</h2> <ul> <li> <a href="#"><i class="fa fa-calendar"></i>Management Reporting</a> <h2><i class="fa fa-calendar"></i>Management Reporting</h2> <ul> <li> <a href="#">Acct Transaction Journal</a> </li> <li> <a href="#">Acct Valuation Summary</a> </li> <li> <a href="#">Client Master</a> </li> <li> <a href="#">Client Portfolio by Lot</a> </li> <li> <a href="#">Commission Report</a> </li> <li> <a href="#">Margin Report</a> </li> <li> <a href="#">Money Line Report</a> </li> <li> <a href="#">Security Master</a> </li> <li> <a href="#">Unrealized G/L Report</a> </li> </ul> </li> <li> <a href="/Reports/Performance">Performance Report</a> </li> <li> <a href="/ReportBatches">Report Batches</a> </li> <li> <a href="#">Historical Pricing</a> </li> <li> <a href="#">Customer Statements</a> </li> <li> <a href="#">Customer Billing</a> </li> </ul> </li> <li> <a href="#"><i class="fa fa-gear"></i>System Maintenance</a> <h2><i class="fa fa-gear"></i>System Maintenance</h2> <ul> <li> <a href="/UserAdministration">User Administration</a> </li> <li> <a href="#"><i class="fa fa-group"></i>Client Administration</a> <h2><i class="fa fa-group"></i>Client Administration</h2> <ul> <li><a href="#">Mgmt Fee Schedule</a></li> <li> <a href="/TransTypes">Transaction Type</a> </li> <li> <a href="/Client/Details">Firm Record Setup</a> </li> <li> <a href="/Advisors">Investment Reps</a> </li> <li><a href="#">Rep Maintenance</a></li> <li> <a href="/AssetTypes">Asset Categorization</a> </li> <li> <a href="/Benchmarks">Benchmark Maintenance</a> </li> <li><a href="#">Currency Listings</a></li> </ul> </li> </ul> </li> <li> <a href="#"><i class="fa fa-save"></i>My Profile</a> <h2><i class="fa fa-save"></i>My Profile</h2> <ul> <li> <a href="/Manage/ChangePassword">Change Password</a> </li> </ul> </li> </ul> </nav> </div> </div> </div> </div> <script src="/Scripts/jquery.multilevelpushmenu.min.js"></script> <script src="/Scripts/bootstrap_integration.js"></script> <script src="/Scripts/Gridster/jquery.gridster.js"></script> <script src="/Scripts/Gridster/gridster-bootstrap.js"></script> <script src="/Scripts/Gridster/underscore.js"></script> <script type="text/javascript"> function updateWidget(widget) { $.ajax({ url: "/Dashboard/UpdateWidget/2" + "?jsonData=" + JSON.stringify(widget), type: "GET", dataType: "json", contentType: 'application/json; charset=utf-8', cache: false, processData: false, success: function (data) { // success code here } }); } var gridster; $(function () { gridster = $(".gridster ul").gridster({ widget_base_dimensions: [160, 155], widget_margins: [10, 11], max_cols: 6, min_cols: 6, serialize_params: function ($w, wgd) { return { x: wgd.col, y: wgd.row, width: wgd.size_x, height: wgd.size_y, id: $($w).attr('id'), class: $($w).attr('class'), htmlContent: $($w).html() }; }, resize: { enabled: true, max_size: [6, 6], min_size: [2, 2], stop: function (e, ui, $widget) { $(".gridster ul li").each(function (index) { var widget = { id: $(this).attr("id"), xaxisval: $(this).attr("data-sizex"), yaxisval: $(this).attr("data-sizey"), datarow: $(this).attr('data-row'), datacol: $(this).attr('data-col') } updateWidget(widget); ResizeChart() }) } }, draggable: { max_size: [6, 6], min_size: [2, 2], stop: function (event, ui) { $(".gridster ul li").each(function (index) { var widget = { id: $(this).attr("id"), xaxisval: $(this).attr("data-sizex"), yaxisval: $(this).attr("data-sizey"), datarow: $(this).attr('data-row'), datacol: $(this).attr('data-col') } updateWidget(widget); }) } } }).data('gridster'); }); </script> <script type="text/javascript" language="javascript"> $(function () { // TODO: find out which widget has a jChart chart4.doUpdate(true); }); </script> </body> </html> -
Tooltip for Pie chart does not work
StatementSolutions replied to StatementSolutions's question in jQuery/jQuery UI
view page source: <!DOCTYPE html> <!--[if lt IE 7]> <html class="no-js lt-ie9 lt-ie8 lt-ie7"> <![endif]--> <!--[if IE 7]> <html class="no-js lt-ie9 lt-ie8"> <![endif]--> <!--[if IE 8]> <html class="no-js lt-ie9"> <![endif]--> <!--[if gt IE 8]><!--> <html class="no-js"> <!--<![endif]--> <head> <meta charset="utf-8" /> <meta http-equiv="X-UA-Compatible" content="IE=edge;chrome=1"> <meta name="viewport" content="width=device-width, initial-scale=1.0"> <title> - ePortfolio Manager</title> <link href='//fonts.googleapis.com/css?family=Open+Sans+Condensed:300,300italic,700&subset=latin,cyrillic-ext,latin-ext,cyrillic' rel='stylesheet' type='text/css'> <link rel="stylesheet" href="//netdna.bootstrapcdn.com/font-awesome/4.0.1/css/font-awesome.min.css"> <link rel="stylesheet" type="text/css" href="/Content/jChartfx/Attributes/jchartfx.attributes.css" /> <link rel="stylesheet" type="text/css" href="/Content/jChartfx/Palettes/jchartfx.palette.css" /> <link href="/Content/gridster/app.css" rel="stylesheet"/> <link href="/Content/gridster/jquery.gridster.css" rel="stylesheet"/> <style> .gridster * { -moz-box-sizing: border-box; -webkit-box-sizing: border-box; box-sizing: border-box; /* Border boxing is used, so the padding, margin and borders are within the width and height of de element. */ color: rgb(112, 112, 112); font-family: Arial; font-size: 11px; margin: 0; /* Margin zero is used to prevent unnecessary white space. */ padding: 0; /* Padding zero is used to prevent unnecessary white space. */ } </style> <link href="/Content/jquery.multilevelpushmenu.css" rel="stylesheet"/> <link href="/Content/bootstrap_integration.css" rel="stylesheet"/> <link href="/Content/bootstrap.css" rel="stylesheet"/> <link href="/Content/bootstrap-theme.css" rel="stylesheet"/> <link href="/Content/site.css" rel="stylesheet"/> <script src="/Scripts/modernizr-2.6.2.js"></script> <script src="/Scripts/jquery-1.10.2.js"></script> <script src="/Scripts/bootstrap.js"></script> <script src="/Scripts/respond.js"></script> <script src="/Scripts/bootstrap-paginator.js"></script> <script src="/Scripts/jChartFx/jchartfx.system.js"></script> <script src="/Scripts/jChartFx/jchartfx.coreBasic.js"></script> </head> <body> <!--[if lt IE 7]> <p class="browsehappy">You are using an <strong>outdated</strong> browser. Please <a href="//browsehappy.com/">upgrade your browser</a> to improve your experience.</p> <![endif]--> <div class="container"> <div id="bodyDiv"> <div class="row"> <div class="col-lg-12 col-md-12 col-sm-12 col-xs-12"> <div id="pushobj"> <div class="navbar-header" style="height:100px"> <div class="navbar-brand" style="padding-left: 30px; padding-top: 5px;"> <a class="site-title" href="/"> <img src="/Content/unensjg2.ooq.jpg" alt="Logo" style="height: 90px;"> </a> <span class="site-desc"></span> </div> </div> <div class="navbar-collapse collapse"> <form action="/Account/LogOff" class="navbar-right" id="logoutForm" method="post"><input name="__RequestVerificationToken" type="hidden" value="CE6-dSYoVqmUBkDe7nZhAxKA4SmpaF865UnS8Mg2jKYznx_b5rJAqn2b8otByDrWmtlVHRuS6cMcGd6kRzUtJwGHBIIxTnxVu6TJQb1CboMe5bdPME8FNv0gHwLsPyXt_Wr8B4q7BiLfCmYSEwLFzQ2" /> <ul class="nav navbar-nav navbar-right"> <li> <a href="/Manage" title="Manage">Hello wleung!</a> </li> <li> <a href="javascript:document.getElementById('logoutForm').submit()">Log off</a> </li> </ul> </form> </div> <div class="body-content"> <ul class="nav nav-tabs"> <li class=""><a href="/Dashboard">HOME</a></li> <li class="active"><a href="/Dashboard/Aggregate/351">AGGREGATE</a></li> <li class="disabledTab"><a href="/Dashboard/Account">ACCOUNT</a></li> <li class=""><a href="/Dashboard/Security">SECURITIES</a></li> </ul> <div class="container tab-content"> <div style="text-align: center;vertical-align:middle; width: 100%;"> <br /> <b><span>Title: Wiley, Mary Glenn Moss</span></b> </div> <div style="position: relative;height: 100%; width: 100%;"> <div id="columns" class="gridster ready"> <ul style="position: relative;height: 100%; width: 100%;"> <li data-row="1" data-col="4" data-sizex="3" data-sizey="2" id="3" style="border:1px solid;"> <div class="widget-head" style="display:block;overflow:no-content;height:10%;width:100%;"> <div class="widget-title text-center" style="padding-top:10px;"><label>ASSET BREAKDOWN</label></div> <div id="id-refresh-3" class="wdgbkg"> </div> <div id="header"> <table class="tablesorter" border="0" cellpadding="0" cellspacing="1" width="100%" height="100%"> <tr> <th class="wdglabel" style="width:65px">Account #</th> <th class="wdgcenter" style="width:150px">Cash &<br/>Cash Equivalents</th> <th class="wdgcenter" style="width:65px">Equities</th> <th class="wdgcenter" style="width:125px">Taxable<br />Fixed Income</th> <th class="wdgcenter" style="width:150px">Non Taxable<br />Fixed Income</th> <th class="wdgcenter" style="width:65px">Other</th> <th class="wdgcenter" style="width:65px">Total</th> </tr> </table> </div> </div> <br/> <br /> <div class="widget-body" style="display:block;overflow:auto;height:85%;width:100%;"> <div class="widget-content"> <table class="tablesorter" border="0" cellpadding="0" cellspacing="1" width="100%"> <tfoot> <tr> <td class="wdgridge2" colspan="7"></td> </tr> </tfoot> <tbody> <tr> <td class="wdglabel wdgridge" style="width:65px"> <a href="/Dashboard/Account/351?AcctNo=011800288%20%20%20"> 11800288 </a> </td> <td class="wdgnumeric wdgridge" style="width:150px"> $49,979.00 </td> <td class="wdgnumeric wdgridge" style="width:65px"> $667,228.67 </td> <td class="wdgnumeric wdgridge" style="width:125px"> $24,264.05 </td> <td class="wdgnumeric wdgridge" style="width:150px"> $574,540.03 </td> <td class="wdgnumeric wdgridge" style="width:65px"> $0.00 </td> <td class="wdgnumeric" style="width:65px"> $1,316,011.75 </td> </tr> <tr> <td class="wdglabel wdgridge" style="width:65px"> <a href="/Dashboard/Account/351?AcctNo=055707243%20%20%20"> 55707243 </a> </td> <td class="wdgnumeric wdgridge" style="width:150px"> $12,990.00 </td> <td class="wdgnumeric wdgridge" style="width:65px"> $164,796.30 </td> <td class="wdgnumeric wdgridge" style="width:125px"> $68,127.45 </td> <td class="wdgnumeric wdgridge" style="width:150px"> $138,434.95 </td> <td class="wdgnumeric wdgridge" style="width:65px"> $0.00 </td> <td class="wdgnumeric" style="width:65px"> $384,348.70 </td> </tr> </tbody> </table> </div> </div> </li> <li data-row="1" data-col="1" data-sizex="3" data-sizey="2" id="4" style="border:1px solid;"> <div class="widget-head" style="display:block;overflow:no-content;height:10%;width:100%;"> <div class="widget-title text-center" style="padding-top:10px;"><label>ASSET ALLOCATION</label></div> <div id="id-refresh-4" class="wdgbkg"> </div> </div> <div class="widget-body" style="display:block;overflow:auto;height:90%;width:100%;"> <div class="widget-content" id="ChartDiv" style="overflow: auto;height:100%;width:100%;"></div> </div> <script type="text/javascript" language="javascript"> var chart4; function LoadPieChart() { chart4 = new cfx.Chart(); chart4.setGallery(cfx.Gallery.Pie); chart4.getAllSeries().getPointLabels().setVisible(true); var pieAttr = chart4.getAllSeries().getGalleryAttributes(); pieAttr.setLabelsInside(true); //chart4.getAllSeries().getPointLabels().setFormat("%l %p%%"); chart4.getAllSeries().getPointLabels().setFormat("%p%%"); var str = [{"AssetTypeDesc":"Cash \u0026 Cash Equivalents","EndMarketValue":62969.00},{"AssetTypeDesc":"Equities","EndMarketValue":832024.97},{"AssetTypeDesc":"Taxable Fixed Income","EndMarketValue":92391.50},{"AssetTypeDesc":"Non Taxable Fixed Income","EndMarketValue":712974.98},{"AssetTypeDesc":"Other Securities","EndMarketValue":0.00}]; chart4.getAxisY().getDataFormat().setDecimals(2); chart4.getView3D().setEnabled(true); chart4.getAllSeries().getPointLabels().setVisible(true); chart4.setDataSource(str); var data = chart4.getData(); data.setSeries(1); data.setPoints(10); chart4.getToolTips().setEnabled(true); chart4.getToolTips().setFormat("%l%"); //chart4.getAllSeries().getPointLabels().setVisible(true); //chart4.getAllSeries().getPointLabels().setAlignment(cfx.StringAlignment.NEAR); chart4.getLegendBox().setVisible(true); chart4.getLegendBox().setWidth(175); chart4.getLegendBox().setDock(cfx.DockArea.Right); chart4.getLegendBox().setContentLayout(cfx.ContentLayout.Near); var divHolder = document.getElementById('ChartDiv'); chart4.create(divHolder); } $(function() { LoadPieChart(); }); //$(window).resize(function() { function ResizeChart() { if (chart4 != null) chart4.doUpdate(true); }; </script> </li> </ul> </div> </div> </div> <hr /> <footer> <p>© 2014~2015 - Statement Solutions, LLC.</p> </footer> </div> </div> </div> <div id="menu"> <nav > <h2><i class="fa fa-reorder" ></i>Menu</h2> <ul> <li> <a href="/DashBoard">Dashboard</a> </li> <li> <a href="#"><i class="fa fa-user"></i>Accounts</a> <h2><i class="fa fa-user"></i>Accounts</h2> <ul> <li> <a href="#"><i class="fa fa-wrench"></i>Account Maintenace</a> <h2><i class="fa fa-wrench"></i>Account Maintenace</h2> <ul> <li> <a href="#">General</a> </li> <li> <a href="#">Joint Acct Info</a> </li> <li> <a href="#">Interested Party Info</a> </li> <li> <a href="#">Investment Objectives</a> </li> </ul> </li> <li> <a href="/Aggregates">Aggregates</a> </li> </ul> </li> <li> <a href="#"><i class="fa fa-book"></i>Account Detail</a> <h2><i class="fa fa-book"></i>Account Detail</h2> <ul> <li> <a href="/Transactions">Transactions</a> </li> <li> <a href="/Positions">Positions</a> </li> <li> <a href="/Benchmarks/Yields">Benchmark Yields</a> </li> </ul> </li> <li> <a href="#"><i class="fa fa-paperclip"></i>Reporting</a> <h2><i class="fa fa-paperclip"></i>Reporting</h2> <ul> <li> <a href="#"><i class="fa fa-calendar"></i>Management Reporting</a> <h2><i class="fa fa-calendar"></i>Management Reporting</h2> <ul> <li> <a href="#">Acct Transaction Journal</a> </li> <li> <a href="#">Acct Valuation Summary</a> </li> <li> <a href="#">Client Master</a> </li> <li> <a href="#">Client Portfolio by Lot</a> </li> <li> <a href="#">Commission Report</a> </li> <li> <a href="#">Margin Report</a> </li> <li> <a href="#">Money Line Report</a> </li> <li> <a href="#">Security Master</a> </li> <li> <a href="#">Unrealized G/L Report</a> </li> </ul> </li> <li> <a href="/Reports/Performance">Performance Report</a> </li> <li> <a href="/ReportBatches">Report Batches</a> </li> <li> <a href="#">Historical Pricing</a> </li> <li> <a href="#">Customer Statements</a> </li> <li> <a href="#">Customer Billing</a> </li> </ul> </li> <li> <a href="#"><i class="fa fa-gear"></i>System Maintenance</a> <h2><i class="fa fa-gear"></i>System Maintenance</h2> <ul> <li> <a href="/UserAdministration">User Administration</a> </li> <li> <a href="#"><i class="fa fa-group"></i>Client Administration</a> <h2><i class="fa fa-group"></i>Client Administration</h2> <ul> <li><a href="#">Mgmt Fee Schedule</a></li> <li> <a href="/TransTypes">Transaction Type</a> </li> <li> <a href="/Client/Details">Firm Record Setup</a> </li> <li> <a href="/Advisors">Investment Reps</a> </li> <li><a href="#">Rep Maintenance</a></li> <li> <a href="/AssetTypes">Asset Categorization</a> </li> <li> <a href="/Benchmarks">Benchmark Maintenance</a> </li> <li><a href="#">Currency Listings</a></li> </ul> </li> </ul> </li> <li> <a href="#"><i class="fa fa-save"></i>My Profile</a> <h2><i class="fa fa-save"></i>My Profile</h2> <ul> <li> <a href="/Manage/ChangePassword">Change Password</a> </li> </ul> </li> </ul> </nav> </div> </div> </div> </div> <script src="/Scripts/jquery.multilevelpushmenu.min.js"></script> <script src="/Scripts/bootstrap_integration.js"></script> <script src="/Scripts/Gridster/jquery.gridster.js"></script> <script src="/Scripts/Gridster/gridster-bootstrap.js"></script> <script src="/Scripts/Gridster/underscore.js"></script> <script type="text/javascript"> function updateWidget(widget) { $.ajax({ url: "/Dashboard/UpdateWidget/2" + "?jsonData=" + JSON.stringify(widget), type: "GET", dataType: "json", contentType: 'application/json; charset=utf-8', cache: false, processData: false, success: function (data) { // success code here } }); } var gridster; $(function () { gridster = $(".gridster ul").gridster({ widget_base_dimensions: [160, 155], widget_margins: [10, 11], max_cols: 6, min_cols: 6, serialize_params: function ($w, wgd) { return { x: wgd.col, y: wgd.row, width: wgd.size_x, height: wgd.size_y, id: $($w).attr('id'), class: $($w).attr('class'), htmlContent: $($w).html() }; }, resize: { enabled: true, max_size: [6, 6], min_size: [2, 2], stop: function (e, ui, $widget) { $(".gridster ul li").each(function (index) { var widget = { id: $(this).attr("id"), xaxisval: $(this).attr("data-sizex"), yaxisval: $(this).attr("data-sizey"), datarow: $(this).attr('data-row'), datacol: $(this).attr('data-col') } updateWidget(widget); ResizeChart() }) } }, draggable: { max_size: [6, 6], min_size: [2, 2], stop: function (event, ui) { $(".gridster ul li").each(function (index) { var widget = { id: $(this).attr("id"), xaxisval: $(this).attr("data-sizex"), yaxisval: $(this).attr("data-sizey"), datarow: $(this).attr('data-row'), datacol: $(this).attr('data-col') } updateWidget(widget); }) } } }).data('gridster'); }); </script> <script type="text/javascript" language="javascript"> $(function () { // TODO: find out which widget has a jChart chart4.doUpdate(true); }); </script> </body> </html> AssetAllocation.cshtml: @model ePortfolio.Models.WidgetViewModel @using System.Web.Script.Serialization; <div class="widget-head" style="display:block;overflow:no-content;height:10%;width:100%;"> <div class="widget-title text-center" style="padding-top:10px;"><label>@Model.Widget.Title</label></div> <div id="id-refresh-@Model.Widget.Id" class="wdgbkg"> </div> @*<div id="header"> <table class="tablesorter" border="0" cellpadding="0" cellspacing="1" width="100%" height="100%"> <tr> <th class="wdgcenter" style="width:50px">Qty/Shares</th> <th class="wdgcenter" style="width:50px">Account #</th> <th class="wdgcenter" style="width:50px">% of Portfolio</th> </tr> </table> </div>*@ </div> <div class="widget-body" style="display:block;overflow:auto;height:90%;width:100%;"> <div class="widget-content" id="ChartDiv" style="overflow: auto;height:100%;width:100%;"></div> </div> <script type="text/javascript" language="javascript"> var chart@(Model.Widget.Id); function LoadPieChart() { chart@(Model.Widget.Id) = new cfx.Chart(); chart@(Model.Widget.Id).setGallery(cfx.Gallery.Pie); chart@(Model.Widget.Id).getAllSeries().getPointLabels().setVisible(true); var pieAttr = chart@(Model.Widget.Id).getAllSeries().getGalleryAttributes(); pieAttr.setLabelsInside(true); //chart@(Model.Widget.Id).getAllSeries().getPointLabels().setFormat("%l %p%%"); chart@(Model.Widget.Id).getAllSeries().getPointLabels().setFormat("%p%%"); var str = @Html.Raw(Json.Encode(ViewData["Asset Allocations Chart"])); chart@(Model.Widget.Id).getAxisY().getDataFormat().setDecimals(2); chart@(Model.Widget.Id).getView3D().setEnabled(true); chart@(Model.Widget.Id).getAllSeries().getPointLabels().setVisible(true); chart@(Model.Widget.Id).setDataSource(str); var data = chart@(Model.Widget.Id).getData(); data.setSeries(1); data.setPoints(10); chart@(Model.Widget.Id).getToolTips().setEnabled(true); chart@(Model.Widget.Id).getToolTips().setFormat("%l%"); //chart@(Model.Widget.Id).getAllSeries().getPointLabels().setVisible(true); //chart@(Model.Widget.Id).getAllSeries().getPointLabels().setAlignment(cfx.StringAlignment.NEAR); chart@(Model.Widget.Id).getLegendBox().setVisible(true); chart@(Model.Widget.Id).getLegendBox().setWidth(175); chart@(Model.Widget.Id).getLegendBox().setDock(cfx.DockArea.Right); chart@(Model.Widget.Id).getLegendBox().setContentLayout(cfx.ContentLayout.Near); @*chart@(Model.Widget.Id).getPlotAreaMargin().setTop(0); chart@(Model.Widget.Id).getPlotAreaMargin().setBottom(0); chart@(Model.Widget.Id).getPlotAreaMargin().setRight(0); chart@(Model.Widget.Id).getPlotAreaMargin().setLeft(0);*@ var divHolder = document.getElementById('ChartDiv'); chart@(Model.Widget.Id).create(divHolder); } $(function() { LoadPieChart(); }); //$(window).resize(function() { function ResizeChart() { if (chart@(Model.Widget.Id) != null) chart@(Model.Widget.Id).doUpdate(true); }; </script> _EmptyLayout.cshtml: <!DOCTYPE html> <!--[if lt IE 7]> <html class="no-js lt-ie9 lt-ie8 lt-ie7"> <![endif]--> <!--[if IE 7]> <html class="no-js lt-ie9 lt-ie8"> <![endif]--> <!--[if IE 8]> <html class="no-js lt-ie9"> <![endif]--> <!--[if gt IE 8]><!--> <html class="no-js"> <!--<![endif]--> <head> <meta charset="utf-8" /> <meta http-equiv="X-UA-Compatible" content="IE=edge;chrome=1"> <meta name="viewport" content="width=device-width, initial-scale=1.0"> <title>@Page.Title - ePortfolio Manager</title> <link href='//fonts.googleapis.com/css?family=Open+Sans+Condensed:300,300italic,700&subset=latin,cyrillic-ext,latin-ext,cyrillic' rel='stylesheet' type='text/css'> <link rel="stylesheet" href="//netdna.bootstrapcdn.com/font-awesome/4.0.1/css/font-awesome.min.css"> @RenderSection("styles", required: false) <link rel="stylesheet" type="text/css" href="~/Content/jChartfx/Attributes/jchartfx.attributes.css" /> <link rel="stylesheet" type="text/css" href="~/Content/jChartfx/Palettes/jchartfx.palette.css" /> @Styles.Render("~/Content/gridster/css") <style> .gridster * { -moz-box-sizing: border-box; -webkit-box-sizing: border-box; box-sizing: border-box; /* Border boxing is used, so the padding, margin and borders are within the width and height of de element. */ color: rgb(112, 112, 112); font-family: Arial; font-size: 11px; margin: 0; /* Margin zero is used to prevent unnecessary white space. */ padding: 0; /* Padding zero is used to prevent unnecessary white space. */ } </style> @Styles.Render("~/Content/css") @Scripts.Render("~/bundles/modernizr") @Scripts.Render("~/bundles/jquery") @Scripts.Render("~/bundles/bootstrap") @Scripts.Render("~/bundles/jchartfx") </head> <body> <!--[if lt IE 7]> <p class="browsehappy">You are using an <strong>outdated</strong> browser. Please <a href="//browsehappy.com/">upgrade your browser</a> to improve your experience.</p> <![endif]--> <div class="container"> <div id="bodyDiv"> <div class="row"> <div class="col-lg-12 col-md-12 col-sm-12 col-xs-12"> <div id="pushobj"> <div class="navbar-header" style="height:100px"> @Html.Partial("_LogoPartial") </div> <div class="navbar-collapse collapse"> @Html.Partial("_LoginPartial") </div> <div class="body-content"> @Html.Partial("_DashboardTabsPartial") <div class="container tab-content"> @RenderBody() </div> <hr /> <footer> <p>© 2014~@DateTime.Now.Year - Statement Solutions, LLC.</p> </footer> </div> </div> </div> <div id="menu"> @Html.Partial("_MenuPartial") </div> </div> </div> </div> @Scripts.Render("~/bundles/multilevelpushmenu") @Scripts.Render("~/bundles/gridster") <script type="text/javascript"> function updateWidget(widget) { $.ajax({ url: "@Html.Raw(Url.Action("UpdateWidget", new { id = @ViewBag.DashboardPageId }))" + "?jsonData=" + JSON.stringify(widget), type: "GET", dataType: "json", contentType: 'application/json; charset=utf-8', cache: false, processData: false, success: function (data) { // success code here } }); } var gridster; $(function () { gridster = $(".gridster ul").gridster({ widget_base_dimensions: [160, 155], widget_margins: [10, 11], max_cols: 6, min_cols: 6, serialize_params: function ($w, wgd) { return { x: wgd.col, y: wgd.row, width: wgd.size_x, height: wgd.size_y, id: $($w).attr('id'), class: $($w).attr('class'), htmlContent: $($w).html() }; }, resize: { enabled: true, max_size: [6, 6], min_size: [2, 2], stop: function (e, ui, $widget) { $(".gridster ul li").each(function (index) { var widget = { id: $(this).attr("id"), xaxisval: $(this).attr("data-sizex"), yaxisval: $(this).attr("data-sizey"), datarow: $(this).attr('data-row'), datacol: $(this).attr('data-col') } updateWidget(widget); ResizeChart() }) } }, draggable: { max_size: [6, 6], min_size: [2, 2], stop: function (event, ui) { $(".gridster ul li").each(function (index) { var widget = { id: $(this).attr("id"), xaxisval: $(this).attr("data-sizex"), yaxisval: $(this).attr("data-sizey"), datarow: $(this).attr('data-row'), datacol: $(this).attr('data-col') } updateWidget(widget); }) } } }).data('gridster'); }); </script> @RenderSection("scripts", required: false) </body> </html> -
Tooltip for Pie chart does not work
StatementSolutions replied to StatementSolutions's question in jQuery/jQuery UI
I think the 'tool tip' is being displayed behind the widget which has drag-n-drop and resize capabilities. Wen I dragged a wdiget with a jchartfx pie chart I noticed the tool tip behind the widget. -
Tooltip for Pie chart does not work
StatementSolutions replied to StatementSolutions's question in jQuery/jQuery UI
View page Source: <!DOCTYPE html> <!--[if lt IE 7]> <html class="no-js lt-ie9 lt-ie8 lt-ie7"> <![endif]--> <!--[if IE 7]> <html class="no-js lt-ie9 lt-ie8"> <![endif]--> <!--[if IE 8]> <html class="no-js lt-ie9"> <![endif]--> <!--[if gt IE 8]><!--> <html class="no-js"> <!--<![endif]--> <head> <meta charset="utf-8" /> <meta http-equiv="X-UA-Compatible" content="IE=edge;chrome=1"> <meta name="viewport" content="width=device-width, initial-scale=1.0"> <title> - ePortfolio Manager</title> <link href='//fonts.googleapis.com/css?family=Open+Sans+Condensed:300,300italic,700&subset=latin,cyrillic-ext,latin-ext,cyrillic' rel='stylesheet' type='text/css'> <link rel="stylesheet" href="//netdna.bootstrapcdn.com/font-awesome/4.0.1/css/font-awesome.min.css"> <link rel="stylesheet" type="text/css" href="/Content/jChartfx/Attributes/jchartfx.attributes.css" /> <link rel="stylesheet" type="text/css" href="/Content/jChartfx/Palettes/jchartfx.palette.css" /> <link href="/Content/gridster/app.css" rel="stylesheet"/> <link href="/Content/gridster/jquery.gridster.css" rel="stylesheet"/> <style> .gridster * { -moz-box-sizing: border-box; -webkit-box-sizing: border-box; box-sizing: border-box; /* Border boxing is used, so the padding, margin and borders are within the width and height of de element. */ color: rgb(112, 112, 112); font-family: Arial; font-size: 11px; margin: 0; /* Margin zero is used to prevent unnecessary white space. */ padding: 0; /* Padding zero is used to prevent unnecessary white space. */ } </style> <link href="/Content/jquery.multilevelpushmenu.css" rel="stylesheet"/> <link href="/Content/bootstrap_integration.css" rel="stylesheet"/> <link href="/Content/bootstrap.css" rel="stylesheet"/> <link href="/Content/bootstrap-theme.css" rel="stylesheet"/> <link href="/Content/site.css" rel="stylesheet"/> <script src="/Scripts/modernizr-2.6.2.js"></script> <script src="/Scripts/jquery-1.10.2.js"></script> <script src="/Scripts/bootstrap.js"></script> <script src="/Scripts/respond.js"></script> <script src="/Scripts/bootstrap-paginator.js"></script> <script src="/Scripts/jChartFx/jchartfx.system.js"></script> <script src="/Scripts/jChartFx/jchartfx.coreBasic.js"></script> </head> <body> <!--[if lt IE 7]> <p class="browsehappy">You are using an <strong>outdated</strong> browser. Please <a href="//browsehappy.com/">upgrade your browser</a> to improve your experience.</p> <![endif]--> <div class="container"> <div id="bodyDiv"> <div class="row"> <div class="col-lg-12 col-md-12 col-sm-12 col-xs-12"> <div id="pushobj"> <div class="navbar-header" style="height:100px"> <div class="navbar-brand" style="padding-left: 30px; padding-top: 5px;"> <a class="site-title" href="/"> <img src="/Content/unensjg2.ooq.jpg" alt="Logo" style="height: 90px;"> </a> <span class="site-desc"></span> </div> </div> <div class="navbar-collapse collapse"> <form action="/Account/LogOff" class="navbar-right" id="logoutForm" method="post"><input name="__RequestVerificationToken" type="hidden" value="qrc7n_MzJL05mW50spaeMPpky3UjLt5PWNL8JZvSYIMUqWwM_ER-2fX3ie2rLY91DqnIbhNCZGqAM9NuVF6K8r7rrCHtJERNZkxCQFAPQ3thBHIWLMkAo1zXo5e5s6F-cgyDHYxR7YNwzmRBKgAojQ2" /> <ul class="nav navbar-nav navbar-right"> <li> <a href="/Manage" title="Manage">Hello wleung!</a> </li> <li> <a href="javascript:document.getElementById('logoutForm').submit()">Log off</a> </li> </ul> </form> </div> <div class="body-content"> <ul class="nav nav-tabs"> <li class=""><a href="/Dashboard">HOME</a></li> <li class="active"><a href="/Dashboard/Aggregate/240">AGGREGATE</a></li> <li class="disabledTab"><a href="/Dashboard/Account">ACCOUNT</a></li> <li class="disabledTab"><a href="/Dashboard/Security">SECURITIES</a></li> </ul> <div class="container tab-content"> <div style="text-align: center;vertical-align:middle; width: 100%;"> <br /> <b><span>Title: Steel, Joan </span></b> </div> <div style="position: relative;height: 100%; width: 100%;"> <div id="columns" class="gridster ready"> <ul style="position: relative;height: 100%; width: 100%;"> <li data-row="1" data-col="1" data-sizex="3" data-sizey="2" id="3" style="border:1px solid;"> <div class="widget-head" style="display:block;overflow:no-content;height:10%;width:100%;"> <div class="widget-title text-center" style="padding-top:10px;"><label>ASSET BREAKDOWN</label></div> <div id="id-refresh-3" class="wdgbkg"> </div> <div id="header"> <table class="tablesorter" border="0" cellpadding="0" cellspacing="1" width="100%" height="100%"> <tr> <th class="wdglabel" style="width:65px">Account #</th> <th class="wdgcenter" style="width:150px">Cash &<br/>Cash Equivalents</th> <th class="wdgcenter" style="width:65px">Equities</th> <th class="wdgcenter" style="width:125px">Taxable<br />Fixed Income</th> <th class="wdgcenter" style="width:150px">Non Taxable<br />Fixed Income</th> <th class="wdgcenter" style="width:65px">Other</th> <th class="wdgcenter" style="width:65px">Total</th> </tr> </table> </div> </div> <br/> <br /> <div class="widget-body" style="display:block;overflow:auto;height:85%;width:100%;"> <div class="widget-content"> <table class="tablesorter" border="0" cellpadding="0" cellspacing="1" width="100%"> <tfoot> <tr> <td class="wdgridge2" colspan="7"></td> </tr> </tfoot> <tbody> <tr> <td class="wdglabel wdgridge" style="width:65px"> <a href="/Dashboard/Account/240?AcctNo=052258649%20%20%20"> 52258649 </a> </td> <td class="wdgnumeric wdgridge" style="width:150px"> $47,210.00 </td> <td class="wdgnumeric wdgridge" style="width:65px"> $88,597.80 </td> <td class="wdgnumeric wdgridge" style="width:125px"> $31,263.45 </td> <td class="wdgnumeric wdgridge" style="width:150px"> $46,603.80 </td> <td class="wdgnumeric wdgridge" style="width:65px"> $0.00 </td> <td class="wdgnumeric" style="width:65px"> $213,675.05 </td> </tr> <tr> <td class="wdglabel wdgridge" style="width:65px"> <a href="/Dashboard/Account/240?AcctNo=086318467%20%20%20"> 86318467 </a> </td> <td class="wdgnumeric wdgridge" style="width:150px"> $24,381.00 </td> <td class="wdgnumeric wdgridge" style="width:65px"> $345,126.47 </td> <td class="wdgnumeric wdgridge" style="width:125px"> $120,729.32 </td> <td class="wdgnumeric wdgridge" style="width:150px"> $51,055.52 </td> <td class="wdgnumeric wdgridge" style="width:65px"> $0.00 </td> <td class="wdgnumeric" style="width:65px"> $541,292.31 </td> </tr> </tbody> </table> </div> </div> </li> <li data-row="1" data-col="4" data-sizex="3" data-sizey="2" id="4" style="border:1px solid;"> <div class="widget-head" style="display:block;overflow:no-content;height:10%;width:100%;"> <div class="widget-title text-center" style="padding-top:10px;"><label>ASSET ALLOCATION</label></div> <div id="id-refresh-4" class="wdgbkg"> </div> </div> <div class="widget-body" style="display:block;overflow:auto;height:90%;width:100%;"> <div class="widget-content" id="ChartDiv" style="overflow: auto;height:100%;width:100%;"></div> </div> <script type="text/javascript" language="javascript"> var chart4; function LoadPieChart() { chart4 = new cfx.Chart(); chart4.setGallery(cfx.Gallery.Pie); chart4.getAllSeries().getPointLabels().setVisible(true); var pieAttr = chart4.getAllSeries().getGalleryAttributes(); pieAttr.setLabelsInside(true); chart4.getAllSeries().getPointLabels().setFormat("%l %p%%"); //chart4.getAllSeries().getPointLabels().setFormat("%p%%"); // chart4.getLegendBox().setVisible(false); var str = [{"AssetTypeDesc":"Cash \u0026 Cash Equivalents","EndMarketValue":71591.00},{"AssetTypeDesc":"Equities","EndMarketValue":433724.27},{"AssetTypeDesc":"Taxable Fixed Income","EndMarketValue":151992.77},{"AssetTypeDesc":"Non Taxable Fixed Income","EndMarketValue":97659.32},{"AssetTypeDesc":"Other Securities","EndMarketValue":0.00}]; chart4.getAxisY().getDataFormat().setDecimals(2); chart4.getView3D().setEnabled(true); chart4.getAllSeries().getPointLabels().setVisible(true); chart4.setDataSource(str); var data = chart4.getData(); data.setSeries(1); data.setPoints(10); //var template = '<DataTemplate xmlns:x="a"><DataTemplate.Resources><MultiplyConverter x:Key="multConverter"></MultiplyConverter><StringConverter x:Key="titleConverter"></StringConverter><Thickness x:Key="padding">7</Thickness></DataTemplate.Resources><Canvas Padding="{Binding Path=Padding}"><Border Margin="0,0,0,0" Stroke="#808080" StrokeThickness="2" CornerRadius="12" CornerPercent="0.4" Canvas.Left="0" Canvas.Top="0" Fill="#808080" Segments="{Binding Path=Segments}" StartCorner="{Binding Path=Corner}"><Border.BitmapEffect><BlurBitmapEffect Radius="2"></BlurBitmapEffect></Border.BitmapEffect></Border><Border BorderBrush="#C6C6C6" BorderThickness="1" Background="{Binding Path=Fill}" Opacity="1" CornerPercent="0.4" CornerRadius="12" Segments="{Binding Path=Segments}" StartCorner="{Binding Path=Corner}" Padding="26,8,26,6"><DockPanel x:Name="container" Orientation="Vertical"><TextBlock Text="{Binding Path=Title, Converter={StaticResource titleConverter},ConverterParameter=%u}}" FontSize="{Binding Path=FontSize, Converter={StaticResource multConverter},ConverterParameter=1}" Visible="{Binding Path=TitleVisible}" HorizontalAlignment="Center" Foreground="#3D3D3D" Margin="3,0,3,6"></TextBlock></DockPanel></Border></Canvas></DataTemplate>'; //var tooltips = chart4.getToolTips(); //tooltips.setBorderTemplate(template); //tooltips.setEnabled(true); chart4.getToolTips().setEnabled(true); chart4.getToolTips().setFormat("%l%"); //chart4.getAllSeries().getPointLabels().setVisible(true); //chart4.getAllSeries().getPointLabels().setAlignment(cfx.StringAlignment.NEAR); chart4.getLegendBox().setVisible(false); //chart4.getLegendBox().setWidth(500); //chart4.getLegendBox().setDock(cfx.DockArea.Top); //chart4.getLegendBox().setContentLayout(cfx.ContentLayout.Center); var divHolder = document.getElementById('ChartDiv'); chart4.create(divHolder); } $(function() { LoadPieChart(); }); //$(window).resize(function() { function ResizeChart() { if (chart4 != null) chart4.doUpdate(true); }; </script> </li> </ul> </div> </div> </div> <hr /> <footer> <p>© 2014~2015 - Statement Solutions, LLC.</p> </footer> </div> </div> </div> <div id="menu"> <nav > <h2><i class="fa fa-reorder" ></i>Menu</h2> <ul> <li> <a href="/DashBoard">Dashboard</a> </li> <li> <a href="#"><i class="fa fa-user"></i>Accounts</a> <h2><i class="fa fa-user"></i>Accounts</h2> <ul> <li> <a href="#"><i class="fa fa-wrench"></i>Account Maintenace</a> <h2><i class="fa fa-wrench"></i>Account Maintenace</h2> <ul> <li> <a href="#">General</a> </li> <li> <a href="#">Joint Acct Info</a> </li> <li> <a href="#">Interested Party Info</a> </li> <li> <a href="#">Investment Objectives</a> </li> </ul> </li> <li> <a href="/Aggregates">Aggregates</a> </li> </ul> </li> <li> <a href="#"><i class="fa fa-book"></i>Account Detail</a> <h2><i class="fa fa-book"></i>Account Detail</h2> <ul> <li> <a href="/Transactions">Transactions</a> </li> <li> <a href="/Positions">Positions</a> </li> <li> <a href="/Benchmarks/Yields">Benchmark Yields</a> </li> </ul> </li> <li> <a href="#"><i class="fa fa-paperclip"></i>Reporting</a> <h2><i class="fa fa-paperclip"></i>Reporting</h2> <ul> <li> <a href="#"><i class="fa fa-calendar"></i>Management Reporting</a> <h2><i class="fa fa-calendar"></i>Management Reporting</h2> <ul> <li> <a href="#">Acct Transaction Journal</a> </li> <li> <a href="#">Acct Valuation Summary</a> </li> <li> <a href="#">Client Master</a> </li> <li> <a href="#">Client Portfolio by Lot</a> </li> <li> <a href="#">Commission Report</a> </li> <li> <a href="#">Margin Report</a> </li> <li> <a href="#">Money Line Report</a> </li> <li> <a href="#">Security Master</a> </li> <li> <a href="#">Unrealized G/L Report</a> </li> </ul> </li> <li> <a href="/Reports/Performance">Performance Report</a> </li> <li> <a href="/ReportBatches">Report Batches</a> </li> <li> <a href="#">Historical Pricing</a> </li> <li> <a href="#">Customer Statements</a> </li> <li> <a href="#">Customer Billing</a> </li> </ul> </li> <li> <a href="#"><i class="fa fa-gear"></i>System Maintenance</a> <h2><i class="fa fa-gear"></i>System Maintenance</h2> <ul> <li> <a href="/UserAdministration">User Administration</a> </li> <li> <a href="#"><i class="fa fa-group"></i>Client Administration</a> <h2><i class="fa fa-group"></i>Client Administration</h2> <ul> <li><a href="#">Mgmt Fee Schedule</a></li> <li> <a href="/TransTypes">Transaction Type</a> </li> <li> <a href="/Client/Details">Firm Record Setup</a> </li> <li> <a href="/Advisors">Investment Reps</a> </li> <li><a href="#">Rep Maintenance</a></li> <li> <a href="/AssetTypes">Asset Categorization</a> </li> <li> <a href="/Benchmarks">Benchmark Maintenance</a> </li> <li><a href="#">Currency Listings</a></li> </ul> </li> </ul> </li> <li> <a href="#"><i class="fa fa-save"></i>My Profile</a> <h2><i class="fa fa-save"></i>My Profile</h2> <ul> <li> <a href="/Manage/ChangePassword">Change Password</a> </li> </ul> </li> </ul> </nav> </div> </div> </div> </div> <script src="/Scripts/jquery.multilevelpushmenu.min.js"></script> <script src="/Scripts/bootstrap_integration.js"></script> <script src="/Scripts/Gridster/jquery.gridster.js"></script> <script src="/Scripts/Gridster/gridster-bootstrap.js"></script> <script src="/Scripts/Gridster/underscore.js"></script> <script type="text/javascript"> function updateWidget(widget) { $.ajax({ url: "/Dashboard/UpdateWidget/2" + "?jsonData=" + JSON.stringify(widget), type: "GET", dataType: "json", contentType: 'application/json; charset=utf-8', cache: false, processData: false, success: function (data) { // success code here } }); } var gridster; $(function () { gridster = $(".gridster ul").gridster({ widget_base_dimensions: [160, 155], widget_margins: [10, 11], max_cols: 6, min_cols: 6, serialize_params: function ($w, wgd) { return { x: wgd.col, y: wgd.row, width: wgd.size_x, height: wgd.size_y, id: $($w).attr('id'), class: $($w).attr('class'), htmlContent: $($w).html() }; }, resize: { enabled: true, max_size: [6, 6], min_size: [2, 2], stop: function (e, ui, $widget) { $(".gridster ul li").each(function (index) { var widget = { id: $(this).attr("id"), xaxisval: $(this).attr("data-sizex"), yaxisval: $(this).attr("data-sizey"), datarow: $(this).attr('data-row'), datacol: $(this).attr('data-col') } updateWidget(widget); ResizeChart() }) } }, draggable: { max_size: [6, 6], min_size: [2, 2], stop: function (event, ui) { $(".gridster ul li").each(function (index) { var widget = { id: $(this).attr("id"), xaxisval: $(this).attr("data-sizex"), yaxisval: $(this).attr("data-sizey"), datarow: $(this).attr('data-row'), datacol: $(this).attr('data-col') } updateWidget(widget); }) } } }).data('gridster'); }); </script> <script type="text/javascript" language="javascript"> $(function () { // TODO: find out which widget has a jChart chart4.doUpdate(true); }); </script> </body> </html> _EmptyLaylout.cshtml: <!DOCTYPE html> <!--[if lt IE 7]> <html class="no-js lt-ie9 lt-ie8 lt-ie7"> <![endif]--> <!--[if IE 7]> <html class="no-js lt-ie9 lt-ie8"> <![endif]--> <!--[if IE 8]> <html class="no-js lt-ie9"> <![endif]--> <!--[if gt IE 8]><!--> <html class="no-js"> <!--<![endif]--> <head> <meta charset="utf-8" /> <meta http-equiv="X-UA-Compatible" content="IE=edge;chrome=1"> <meta name="viewport" content="width=device-width, initial-scale=1.0"> <title>@Page.Title - ePortfolio Manager</title> <link href='//fonts.googleapis.com/css?family=Open+Sans+Condensed:300,300italic,700&subset=latin,cyrillic-ext,latin-ext,cyrillic' rel='stylesheet' type='text/css'> <link rel="stylesheet" href="//netdna.bootstrapcdn.com/font-awesome/4.0.1/css/font-awesome.min.css"> @RenderSection("styles", required: false) <link rel="stylesheet" type="text/css" href="~/Content/jChartfx/Attributes/jchartfx.attributes.css" /> <link rel="stylesheet" type="text/css" href="~/Content/jChartfx/Palettes/jchartfx.palette.css" /> @Styles.Render("~/Content/gridster/css") <style> .gridster * { -moz-box-sizing: border-box; -webkit-box-sizing: border-box; box-sizing: border-box; /* Border boxing is used, so the padding, margin and borders are within the width and height of de element. */ color: rgb(112, 112, 112); font-family: Arial; font-size: 11px; margin: 0; /* Margin zero is used to prevent unnecessary white space. */ padding: 0; /* Padding zero is used to prevent unnecessary white space. */ } </style> @Styles.Render("~/Content/css") @Scripts.Render("~/bundles/modernizr") @Scripts.Render("~/bundles/jquery") @Scripts.Render("~/bundles/bootstrap") @Scripts.Render("~/bundles/jchartfx") </head> <body> <!--[if lt IE 7]> <p class="browsehappy">You are using an <strong>outdated</strong> browser. Please <a href="//browsehappy.com/">upgrade your browser</a> to improve your experience.</p> <![endif]--> <div class="container"> <div id="bodyDiv"> <div class="row"> <div class="col-lg-12 col-md-12 col-sm-12 col-xs-12"> <div id="pushobj"> <div class="navbar-header" style="height:100px"> @Html.Partial("_LogoPartial") </div> <div class="navbar-collapse collapse"> @Html.Partial("_LoginPartial") </div> <div class="body-content"> @Html.Partial("_DashboardTabsPartial") <div class="container tab-content"> @RenderBody() </div> <hr /> <footer> <p>© 2014~@DateTime.Now.Year - Statement Solutions, LLC.</p> </footer> </div> </div> </div> <div id="menu"> @Html.Partial("_MenuPartial") </div> </div> </div> </div> @Scripts.Render("~/bundles/multilevelpushmenu") @Scripts.Render("~/bundles/gridster") <script type="text/javascript"> function updateWidget(widget) { $.ajax({ url: "@Html.Raw(Url.Action("UpdateWidget", new { id = @ViewBag.DashboardPageId }))" + "?jsonData=" + JSON.stringify(widget), type: "GET", dataType: "json", contentType: 'application/json; charset=utf-8', cache: false, processData: false, success: function (data) { // success code here } }); } var gridster; $(function () { gridster = $(".gridster ul").gridster({ widget_base_dimensions: [160, 155], widget_margins: [10, 11], max_cols: 6, min_cols: 6, serialize_params: function ($w, wgd) { return { x: wgd.col, y: wgd.row, width: wgd.size_x, height: wgd.size_y, id: $($w).attr('id'), class: $($w).attr('class'), htmlContent: $($w).html() }; }, resize: { enabled: true, max_size: [6, 6], min_size: [2, 2], stop: function (e, ui, $widget) { $(".gridster ul li").each(function (index) { var widget = { id: $(this).attr("id"), xaxisval: $(this).attr("data-sizex"), yaxisval: $(this).attr("data-sizey"), datarow: $(this).attr('data-row'), datacol: $(this).attr('data-col') } updateWidget(widget); ResizeChart() }) } }, draggable: { max_size: [6, 6], min_size: [2, 2], stop: function (event, ui) { $(".gridster ul li").each(function (index) { var widget = { id: $(this).attr("id"), xaxisval: $(this).attr("data-sizex"), yaxisval: $(this).attr("data-sizey"), datarow: $(this).attr('data-row'), datacol: $(this).attr('data-col') } updateWidget(widget); }) } } }).data('gridster'); }); </script> @RenderSection("scripts", required: false) </body> </html> AssetAllocation.cshtml: @model ePortfolio.Models.WidgetViewModel @using System.Web.Script.Serialization; <div class="widget-head" style="display:block;overflow:no-content;height:10%;width:100%;"> <div class="widget-title text-center" style="padding-top:10px;"><label>@Model.Widget.Title</label></div> <div id="id-refresh-@Model.Widget.Id" class="wdgbkg"> </div> @*<div id="header"> <table class="tablesorter" border="0" cellpadding="0" cellspacing="1" width="100%" height="100%"> <tr> <th class="wdgcenter" style="width:50px">Qty/Shares</th> <th class="wdgcenter" style="width:50px">Account #</th> <th class="wdgcenter" style="width:50px">% of Portfolio</th> </tr> </table> </div>*@ </div> <div class="widget-body" style="display:block;overflow:auto;height:90%;width:100%;"> <div class="widget-content" id="ChartDiv" style="overflow: auto;height:100%;width:100%;"></div> </div> <script type="text/javascript" language="javascript"> var chart@(Model.Widget.Id); function LoadPieChart() { chart@(Model.Widget.Id) = new cfx.Chart(); chart@(Model.Widget.Id).setGallery(cfx.Gallery.Pie); chart@(Model.Widget.Id).getAllSeries().getPointLabels().setVisible(true); var pieAttr = chart@(Model.Widget.Id).getAllSeries().getGalleryAttributes(); pieAttr.setLabelsInside(true); chart@(Model.Widget.Id).getAllSeries().getPointLabels().setFormat("%l %p%%"); //chart@(Model.Widget.Id).getAllSeries().getPointLabels().setFormat("%p%%"); // chart@(Model.Widget.Id).getLegendBox().setVisible(false); var str = @Html.Raw(Json.Encode(ViewData["Asset Allocations Chart"])); chart@(Model.Widget.Id).getAxisY().getDataFormat().setDecimals(2); chart@(Model.Widget.Id).getView3D().setEnabled(true); chart@(Model.Widget.Id).getAllSeries().getPointLabels().setVisible(true); chart@(Model.Widget.Id).setDataSource(str); var data = chart@(Model.Widget.Id).getData(); data.setSeries(1); data.setPoints(10); //var template = '<DataTemplate xmlns:x="a"><DataTemplate.Resources><MultiplyConverter x:Key="multConverter"></MultiplyConverter><StringConverter x:Key="titleConverter"></StringConverter><Thickness x:Key="padding">7</Thickness></DataTemplate.Resources><Canvas Padding="{Binding Path=Padding}"><Border Margin="0,0,0,0" Stroke="#808080" StrokeThickness="2" CornerRadius="12" CornerPercent="0.4" Canvas.Left="0" Canvas.Top="0" Fill="#808080" Segments="{Binding Path=Segments}" StartCorner="{Binding Path=Corner}"><Border.BitmapEffect><BlurBitmapEffect Radius="2"></BlurBitmapEffect></Border.BitmapEffect></Border><Border BorderBrush="#C6C6C6" BorderThickness="1" Background="{Binding Path=Fill}" Opacity="1" CornerPercent="0.4" CornerRadius="12" Segments="{Binding Path=Segments}" StartCorner="{Binding Path=Corner}" Padding="26,8,26,6"><DockPanel x:Name="container" Orientation="Vertical"><TextBlock Text="{Binding Path=Title, Converter={StaticResource titleConverter},ConverterParameter=%u}}" FontSize="{Binding Path=FontSize, Converter={StaticResource multConverter},ConverterParameter=1}" Visible="{Binding Path=TitleVisible}" HorizontalAlignment="Center" Foreground="#3D3D3D" Margin="3,0,3,6"></TextBlock></DockPanel></Border></Canvas></DataTemplate>'; //var tooltips = chart@(Model.Widget.Id).getToolTips(); //tooltips.setBorderTemplate(template); //tooltips.setEnabled(true); chart@(Model.Widget.Id).getToolTips().setEnabled(true); chart@(Model.Widget.Id).getToolTips().setFormat("%l%"); //chart@(Model.Widget.Id).getAllSeries().getPointLabels().setVisible(true); //chart@(Model.Widget.Id).getAllSeries().getPointLabels().setAlignment(cfx.StringAlignment.NEAR); chart@(Model.Widget.Id).getLegendBox().setVisible(false); //chart@(Model.Widget.Id).getLegendBox().setWidth(500); //chart@(Model.Widget.Id).getLegendBox().setDock(cfx.DockArea.Top); //chart@(Model.Widget.Id).getLegendBox().setContentLayout(cfx.ContentLayout.Center); @*chart@(Model.Widget.Id).getPlotAreaMargin().setTop(0); chart@(Model.Widget.Id).getPlotAreaMargin().setBottom(0); chart@(Model.Widget.Id).getPlotAreaMargin().setRight(0); chart@(Model.Widget.Id).getPlotAreaMargin().setLeft(0);*@ var divHolder = document.getElementById('ChartDiv'); chart@(Model.Widget.Id).create(divHolder); } $(function() { LoadPieChart(); }); //$(window).resize(function() { function ResizeChart() { if (chart@(Model.Widget.Id) != null) chart@(Model.Widget.Id).doUpdate(true); }; </script> -
Tooltip for Pie chart does not work
StatementSolutions replied to StatementSolutions's question in jQuery/jQuery UI
I believe I am using ver 7.4.5599 -
Tooltip for Pie chart does not work
StatementSolutions replied to StatementSolutions's question in jQuery/jQuery UI
I placed a jchartfx pie chart onto a widget that is draggable and resizeable. When I click on an section of the pie chart it seems that the tool tip is behind the widget. When I drag the widget I see a tool tip. master page: <!DOCTYPE html> <!--[if lt IE 7]> <html class="no-js lt-ie9 lt-ie8 lt-ie7"> <![endif]--> <!--[if IE 7]> <html class="no-js lt-ie9 lt-ie8"> <![endif]--> <!--[if IE 8]> <html class="no-js lt-ie9"> <![endif]--> <!--[if gt IE 8]><!--> <html class="no-js"> <!--<![endif]--> <head> <meta charset="utf-8" /> <meta http-equiv="X-UA-Compatible" content="IE=edge;chrome=1"> <meta name="viewport" content="width=device-width, initial-scale=1.0"> <title>@Page.Title - ePortfolio Manager</title> <link href='//fonts.googleapis.com/css?family=Open+Sans+Condensed:300,300italic,700&subset=latin,cyrillic-ext,latin-ext,cyrillic' rel='stylesheet' type='text/css'> <link rel="stylesheet" href="//netdna.bootstrapcdn.com/font-awesome/4.0.1/css/font-awesome.min.css"> @RenderSection("styles", required: false) <link rel="stylesheet" type="text/css" href="~/Content/jChartfx/Attributes/jchartfx.attributes.css" /> <link rel="stylesheet" type="text/css" href="~/Content/jChartfx/Palettes/jchartfx.palette.css" /> @Styles.Render("~/Content/gridster/css") <style> .gridster * { -moz-box-sizing: border-box; -webkit-box-sizing: border-box; box-sizing: border-box; /* Border boxing is used, so the padding, margin and borders are within the width and height of de element. */ color: rgb(112, 112, 112); font-family: Arial; font-size: 11px; margin: 0; /* Margin zero is used to prevent unnecessary white space. */ padding: 0; /* Padding zero is used to prevent unnecessary white space. */ } </style> @Styles.Render("~/Content/css") @Scripts.Render("~/bundles/modernizr") @Scripts.Render("~/bundles/jquery") @Scripts.Render("~/bundles/bootstrap") @Scripts.Render("~/bundles/jchartfx") </head> <body> <!--[if lt IE 7]> <p class="browsehappy">You are using an <strong>outdated</strong> browser. Please <a href="//browsehappy.com/">upgrade your browser</a> to improve your experience.</p> <![endif]--> <div class="container"> <div id="bodyDiv"> <div class="row"> <div class="col-lg-12 col-md-12 col-sm-12 col-xs-12"> <div id="pushobj"> <div class="navbar-header" style="height:100px"> @Html.Partial("_LogoPartial") </div> <div class="navbar-collapse collapse"> @Html.Partial("_LoginPartial") </div> <div class="body-content"> @Html.Partial("_DashboardTabsPartial") <div class="container tab-content"> @RenderBody() </div> <hr /> <footer> <p>© 2014~@DateTime.Now.Year - Statement Solutions, LLC.</p> </footer> </div> </div> </div> <div id="menu"> @Html.Partial("_MenuPartial") </div> </div> </div> </div> @Scripts.Render("~/bundles/multilevelpushmenu") @Scripts.Render("~/bundles/gridster") <script type="text/javascript"> function updateWidget(widget) { $.ajax({ url: "@Html.Raw(Url.Action("UpdateWidget", new { id = @ViewBag.DashboardPageId }))" + "?jsonData=" + JSON.stringify(widget), type: "GET", dataType: "json", contentType: 'application/json; charset=utf-8', cache: false, processData: false, success: function (data) { // success code here } }); } var gridster; $(function () { gridster = $(".gridster ul").gridster({ widget_base_dimensions: [160, 155], widget_margins: [10, 11], max_cols: 6, min_cols: 6, serialize_params: function ($w, wgd) { return { x: wgd.col, y: wgd.row, width: wgd.size_x, height: wgd.size_y, id: $($w).attr('id'), class: $($w).attr('class'), htmlContent: $($w).html() }; }, resize: { enabled: true, max_size: [6, 6], min_size: [2, 2], stop: function (e, ui, $widget) { $(".gridster ul li").each(function (index) { var widget = { id: $(this).attr("id"), xaxisval: $(this).attr("data-sizex"), yaxisval: $(this).attr("data-sizey"), datarow: $(this).attr('data-row'), datacol: $(this).attr('data-col') } updateWidget(widget); ResizeChart() }) } }, draggable: { max_size: [6, 6], min_size: [2, 2], stop: function (event, ui) { $(".gridster ul li").each(function (index) { var widget = { id: $(this).attr("id"), xaxisval: $(this).attr("data-sizex"), yaxisval: $(this).attr("data-sizey"), datarow: $(this).attr('data-row'), datacol: $(this).attr('data-col') } updateWidget(widget); }) } } }).data('gridster'); }); </script> @RenderSection("scripts", required: false) </body> </html> page: @model ePortfolio.Models.WidgetViewModel @using System.Web.Script.Serialization; <div class="widget-head" style="display:block;overflow:no-content;height:10%;width:100%;"> <div class="widget-title text-center" style="padding-top:10px;"><label>@Model.Widget.Title</label></div> <div id="id-refresh-@Model.Widget.Id" class="wdgbkg"> </div> @*<div id="header"> <table class="tablesorter" border="0" cellpadding="0" cellspacing="1" width="100%" height="100%"> <tr> <th class="wdgcenter" style="width:50px">Qty/Shares</th> <th class="wdgcenter" style="width:50px">Account #</th> <th class="wdgcenter" style="width:50px">% of Portfolio</th> </tr> </table> </div>*@ </div> <div class="widget-body" style="display:block;overflow:auto;height:90%;width:100%;"> <div class="widget-content" id="ChartDiv" style="overflow: auto;height:100%;width:100%;"></div> </div> <script type="text/javascript" language="javascript"> var chart@(Model.Widget.Id); function LoadPieChart() { chart@(Model.Widget.Id) = new cfx.Chart(); chart@(Model.Widget.Id).setGallery(cfx.Gallery.Pie); chart@(Model.Widget.Id).getAllSeries().getPointLabels().setVisible(true); var pieAttr = chart@(Model.Widget.Id).getAllSeries().getGalleryAttributes(); pieAttr.setLabelsInside(true); //chart@(Model.Widget.Id).getAllSeries().getPointLabels().setFormat("%l %p%%"); chart@(Model.Widget.Id).getAllSeries().getPointLabels().setFormat("%p%%"); // chart@(Model.Widget.Id).getLegendBox().setVisible(false); var str = @Html.Raw(Json.Encode(ViewData["Asset Allocations Chart"])); chart@(Model.Widget.Id).getAxisY().getDataFormat().setDecimals(2); chart@(Model.Widget.Id).getView3D().setEnabled(true); chart@(Model.Widget.Id).getAllSeries().getPointLabels().setVisible(true); chart@(Model.Widget.Id).setDataSource(str); var data = chart@(Model.Widget.Id).getData(); data.setSeries(1); data.setPoints(10); //var template = '<DataTemplate xmlns:x="a"><DataTemplate.Resources><MultiplyConverter x:Key="multConverter"></MultiplyConverter><StringConverter x:Key="titleConverter"></StringConverter><Thickness x:Key="padding">7</Thickness></DataTemplate.Resources><Canvas Padding="{Binding Path=Padding}"><Border Margin="0,0,0,0" Stroke="#808080" StrokeThickness="2" CornerRadius="12" CornerPercent="0.4" Canvas.Left="0" Canvas.Top="0" Fill="#808080" Segments="{Binding Path=Segments}" StartCorner="{Binding Path=Corner}"><Border.BitmapEffect><BlurBitmapEffect Radius="2"></BlurBitmapEffect></Border.BitmapEffect></Border><Border BorderBrush="#C6C6C6" BorderThickness="1" Background="{Binding Path=Fill}" Opacity="1" CornerPercent="0.4" CornerRadius="12" Segments="{Binding Path=Segments}" StartCorner="{Binding Path=Corner}" Padding="26,8,26,6"><DockPanel x:Name="container" Orientation="Vertical"><TextBlock Text="{Binding Path=Title, Converter={StaticResource titleConverter},ConverterParameter=%u}}" FontSize="{Binding Path=FontSize, Converter={StaticResource multConverter},ConverterParameter=1}" Visible="{Binding Path=TitleVisible}" HorizontalAlignment="Center" Foreground="#3D3D3D" Margin="3,0,3,6"></TextBlock></DockPanel></Border></Canvas></DataTemplate>'; //var tooltips = chart@(Model.Widget.Id).getToolTips(); //tooltips.setBorderTemplate(template); //tooltips.setEnabled(true); chart@(Model.Widget.Id).getToolTips().setEnabled(true); chart@(Model.Widget.Id).getToolTips().setFormat("%l%"); //chart@(Model.Widget.Id).getAllSeries().getPointLabels().setVisible(true); //chart@(Model.Widget.Id).getAllSeries().getPointLabels().setAlignment(cfx.StringAlignment.NEAR); chart@(Model.Widget.Id).getLegendBox().setVisible(false); //chart@(Model.Widget.Id).getLegendBox().setWidth(500); //chart@(Model.Widget.Id).getLegendBox().setDock(cfx.DockArea.Top); //chart@(Model.Widget.Id).getLegendBox().setContentLayout(cfx.ContentLayout.Center); @*chart@(Model.Widget.Id).getPlotAreaMargin().setTop(0); chart@(Model.Widget.Id).getPlotAreaMargin().setBottom(0); chart@(Model.Widget.Id).getPlotAreaMargin().setRight(0); chart@(Model.Widget.Id).getPlotAreaMargin().setLeft(0);*@ var divHolder = document.getElementById('ChartDiv'); chart@(Model.Widget.Id).create(divHolder); } $(function() { LoadPieChart(); }); //$(window).resize(function() { function ResizeChart() { if (chart@(Model.Widget.Id) != null) chart@(Model.Widget.Id).doUpdate(true); }; </script> -
I created a pie chart using jchartfx. I am trying to get the tooltip to work as one hovers over a section of the pie the detail info should appear. Nothing happens when I hove the cursor over the pie chart. chart@(Model.Widget.Id).GetToolTips().setenabled(true); chart@(Model.Widget.Id).GetToolTips().SetFormat("%l %p%%);
-
Tooltip when hovering an area of the chart
StatementSolutions posted a question in General Questions
Is there a way to when hovering a cursor over an area of a chart it displays a text descipton of that area? -
jChartfx responsive
StatementSolutions replied to StatementSolutions's question in General Questions
How can I specify a 'tool tip' lkike feature. When mouse is hovering over an area of the chart it displays the text for that area. -
I have a chart using jChartfx that is rendered on a widget. This widget is resizeable. How do I resize the jchartfx chart as the widget is being resized? Code: @model ePortfolio.Models.WidgetViewModel @using System.Web.Script.Serialization; @{ var x = Model.GetWidgetUser(); } <li data-row="@x.data_row" data-col="@x.data_col" data-sizex="@x.data_sizex" data-sizey="@x.data_sizey" id="@x.WidgetId" style="border: solid"> @*<div data-role="navbar" class="widget-head" id="navcontainer"> @Html.DisplayFor(model => model, "WidgetHeader"); </div>*@ <div id="btn" style="overflow: no-content;width:100%;"> <div id="idRefresh" style="position: absolute; right:0px; top: 0px; display:inline;background:url(../../Content/images/refresh.gif) no-repeat;width: 24px; height: 20px; text-indent: -9999em; margin: 8px 0 8px 4px; outline: none;"> </div> <div id="idResize" style="position: absolute; right:20px; top: 0px; display:inline;background:url(../../Content/images/resize.png) no-repeat;width: 24px; height: 20px; text-indent: -9999em; margin: 8px 0 8px 4px; outline: none;"></div> <div id="idPin" style="position: absolute; right:40px; top: 0px; display:inline;background:url(../../Content/images/pin.png) no-repeat;width: 24px; height: 20px; text-indent: -9999em; margin: 8px 0 8px 4px; outline: none;"> </div> <div id="idText" style="position: absolute; right:50%; top: 20px; display:inline; height: 20px; "><h5>@Model.Widget.Title</h5></div> </div> <br /><br /><br /> <div style="overflow: auto;height:93%;"> <div id="ChartDiv" style="overflow: auto;height:288px;"></div> </div> </li> <script type="text/javascript" language="javascript"> var chart1; function LoadPieChart() { chart1 = new cfx.Chart(); chart1.setGallery(cfx.Gallery.Pie); chart1.getAllSeries().getPointLabels().setVisible(true); var pieAttr = chart1.getAllSeries().getGalleryAttributes(); pieAttr.setLabelsInside(false); chart1.getAllSeries().getPointLabels().setFormat("%l %p%%"); chart1.getLegendBox().setVisible(false); var str = @Html.Raw(Json.Encode(ViewData["Asset Allocations Chart"])); chart1.getAxisY().getDataFormat().setDecimals(2); chart1.getView3D().setEnabled(true); chart1.getAllSeries().getPointLabels().setVisible(true); //console.log("1: "+str) chart1.setDataSource(str); var data = chart1.getData(); data.setSeries(1); data.setPoints(10); chart1.getAllSeries().getPointLabels().setVisible(true); chart1.getAllSeries().getPointLabels().setAlignment(cfx.StringAlignment.NEAR); chart1.getLegendBox().setVisible(false); //chart1.getLegendBox().setWidth(50); //chart1.getLegendBox().setDock(cfx.DockArea.Right); //chart1.getLegendBox().setContentLayout(cfx.ContentLayout.Near); chart1.getPlotAreaMargin().setTop(0); chart1.getPlotAreaMargin().setBottom(0); chart1.getPlotAreaMargin().setRight(0); chart1.getPlotAreaMargin().setLeft(0); var divHolder = document.getElementById('ChartDiv'); chart1.create(divHolder); } $(function() { LoadPieChart(); }); $(window).resize(function() { if (chart1 != null) chart1.doUpdate(true); }); </script>
-
Pie IE & Chrome don't look the same
StatementSolutions replied to StatementSolutions's question in General Questions
why are some label truncated on a pie chart? Code: <html> <head> <meta charset="utf-8"> <meta http-equiv="X-UA-Compatible" content="IE=edge"> <title></title> <meta name="viewport" content="width=device-width, initial-scale=1"> <meta name="description" content=""> <style> * { -moz-box-sizing: border-box; -webkit-box-sizing: border-box; box-sizing: border-box; /* Border boxing is used, so the padding, margin and borders are within the width and height of de element. */ color: rgb(112, 112, 112); font-family: Arial; font-size: 11px; margin: 0; /* Margin zero is used to prevent unnecessary white space. */ padding: 0; /* Padding zero is used to prevent unnecessary white space. */ } </style> </head> <body> @RenderBody() <script type="text/javascript" src="~/Scripts/jquery.min.js"></script> <script type="text/javascript" src="~/Scripts/jChartFx/jchartfx.system.js"></script> <script type="text/javascript" src="~/Scripts/jChartFx/jchartfx.coreBasic.js"></script> @* <script type="text/javascript" src="~/Scripts/jChart/jchartfx.userinterface.js"></script> <link rel="stylesheet" type="text/css" href="~/Content/jChart/jchartfx.userinterface.css" /> *@ <link rel="stylesheet" type="text/css" href="~/Stylesheets/jChartfx/Attributes/jchartfx.attributes.css" /> <link rel="stylesheet" type="text/css" href="~/Stylesheets/jChartfx/Palettes/jchartfx.palette.css" /> <script type="text/javascript" language="javascript"> @using System.Web.Script.Serialization; var chart1; function LoadPieChart() { chart1 = new cfx.Chart(); chart1.setGallery(cfx.Gallery.Pie); chart1.getAllSeries().getPointLabels().setVisible(true); var pieAttr = chart1.getAllSeries().getGalleryAttributes(); pieAttr.setLabelsInside(false); chart1.getAllSeries().getPointLabels().setFormat("%l %p%%"); chart1.getLegendBox().setVisible(false); var str = @Html.Raw(Json.Encode(ViewData["Asset Allocations Chart"])); chart1.getAxisY().getDataFormat().setDecimals(2); chart1.getView3D().setEnabled(true); chart1.getAllSeries().getPointLabels().setVisible(true); chart1.setDataSource(str); var data = chart1.getData(); data.setSeries(1); data.setPoints(10); chart1.getAllSeries().getPointLabels().setVisible(true); chart1.getAllSeries().getPointLabels().setAlignment(cfx.StringAlignment.NEAR); chart1.getLegendBox().setVisible(false); chart1.getLegendBox().setWidth(50); chart1.getLegendBox().setDock(cfx.DockArea.Right); chart1.getLegendBox().setContentLayout(cfx.ContentLayout.Near); var divHolder = document.getElementById('ChartDiv'); chart1.create(divHolder); } LoadPieChart(); </script> </body> </html> it should read 'Non taxable Fixed Income 81.77%' -
Pie chart does not render using Firefox
StatementSolutions replied to StatementSolutions's question in General Questions
I diabled browerlink and I see an error occur only in firefox when trying to render the pie chart. error: TypeError: m is null http://localhost:62509/Scripts/jChartFx/jchartfx.system.js Line 93 -
Pie chart does not render using Firefox
StatementSolutions replied to StatementSolutions's question in General Questions
I also notice in firefox in console mode I get a whole bunch of this kind of messages browserlink line 37 happening when the page is trying to load: I don't see this happening in IE or chrome. http://localhost:51968/d18da8fa4f5642658c24c936204c7dfe/arterySignalR/poll?transport=longPolling&connectionToken=AQAAANCMnd8BFdERjHoAwE%2FCl%2BsBAAAAR6%2FCcaHSy06hc9uhfX6LDgAAAAACAAAAAAADZgAAwAAAABAAAABHkrT%2FYI%2F4d9eu5R2KNwSWAAAAAASAAACgAAAAEAAAAAKmaVipwWGt9oSPHn22LQMoAAAA2VcOCQ2RDvVeLGD5mQyFhkGo6LZ7Pu9XcwjItlzrF%2BGUwx46rVnCzhQAAAD1Ada2%2FJpnjWLPaTnr1YT8ecKllw%3D%3D&messageId=d-13790217-NC%2C0%7CNj%2C9%7CNk%2C0&requestUrl=http%3A%2F%2Flocalhost%3A62509%2F&browserName=Firefox&userAgent=Mozilla%2F5.0+(Windows+NT+6.1%3B+WOW64%3B+rv%3A38.0)+Gecko%2F20100101+Firefox%2F38.0&tid=3&_=1433272751557 -
Pie chart does not render using Firefox
StatementSolutions replied to StatementSolutions's question in General Questions
I noticed while runnning this in firefox a javascript error occurs in the jchartfx.system.js: 93 TypeError: Cannot read property 'offsetwidth' of null. I do not see this error happending in chrome or IE.
-
Pie chart does not render using Firefox
StatementSolutions replied to StatementSolutions's question in General Questions
These are widgets that is part of another page. When I right-click on the page when the chart is render to view source you don't see everything. I did move the code to render the chart inside the body and still the chart does nopt render in firefox. Why can I not able to attach images so that you can see what I see? Below is code to render the widget: @model ePortfolio.Models.WidgetViewModel @{ Layout = "~/Views/Shared/_ChartWidgetEmptyLayout.cshtml"; } <li class="widget"> <div style="overflow:auto;height:250px;"> <div data-role="navbar" class="widget-head" id="navcontainer"> @Html.DisplayFor(model => model, "WidgetHeader"); </div> <div class="widget-content" id="ChartDiv" style="width:480px;height:230px"></div> </div> </li> Below is the code to render the pie chart: <html> <head> <meta charset="utf-8"> <meta http-equiv="X-UA-Compatible" content="IE=edge"> <title></title> <meta name="viewport" content="width=device-width, initial-scale=1"> <meta name="description" content=""> <style> * { -moz-box-sizing: border-box; -webkit-box-sizing: border-box; box-sizing: border-box; /* Border boxing is used, so the padding, margin and borders are within the width and height of de element. */ color: rgb(112, 112, 112); font-family: Arial; font-size: 11px; margin: 0; /* Margin zero is used to prevent unnecessary white space. */ padding: 0; /* Padding zero is used to prevent unnecessary white space. */ } </style> </head> <body> @RenderBody() <script type="text/javascript" src="~/Scripts/jquery.min.js"></script> <script type="text/javascript" src="~/Scripts/jChartFx/jchartfx.system.js"></script> <script type="text/javascript" src="~/Scripts/jChartFx/jchartfx.coreVector.js"></script> <script type="text/javascript" src="~/Scripts/jChartFx/jchartfx.coreBasic.js"></script> <script type="text/javascript" src="~/Scripts/jChartFx/jchartfx.advanced.js"></script> @* <script type="text/javascript" src="~/Scripts/jChart/jchartfx.userinterface.js"></script> <link rel="stylesheet" type="text/css" href="~/Content/jChart/jchartfx.userinterface.css" /> *@ <link rel="stylesheet" type="text/css" href="~/Stylesheets/jChartfx/Attributes/jchartfx.attributes.css" /> <link rel="stylesheet" type="text/css" href="~/Stylesheets/jChartfx/Palettes/jchartfx.palette.css" /> <script type="text/javascript" language="javascript"> @using System.Web.Script.Serialization; var chart1; function LoadPieChart() { chart1 = new cfx.Chart(); chart1.setGallery(cfx.Gallery.Pie); chart1.getAllSeries().getPointLabels().setVisible(true); var pieAttr = chart1.getAllSeries().getGalleryAttributes(); pieAttr.setLabelsInside(false); chart1.getAllSeries().getPointLabels().setFormat("%l %p%%"); chart1.getLegendBox().setVisible(false); //var str = @Html.Raw(new JavaScriptSerializer().Serialize(ViewData["Asset Allocations Chart"])); var str = @Html.Raw(Json.Encode(ViewData["Asset Allocations Chart"])); @*$.each(@Html.Raw(Json.Encode(ViewData["Asset Allocations Chart"])), function(i, item){ alert(item.AssetTypeCd + "|" + item.AssetType + "|" + item.EndMarketValue); //chart1.setDataSource(item); });*@ chart1.getAxisY().getDataFormat().setDecimals(2); chart1.getView3D().setEnabled(true); chart1.getAllSeries().getPointLabels().setVisible(true); chart1.setDataSource(str); var data = chart1.getData(); data.setSeries(1); data.setPoints(10); chart1.getAllSeries().getPointLabels().setVisible(true); chart1.getAllSeries().getPointLabels().setAlignment(cfx.StringAlignment.NEAR); chart1.getLegendBox().setVisible(false); chart1.getLegendBox().setWidth(50); chart1.getLegendBox().setDock(cfx.DockArea.Right); chart1.getLegendBox().setContentLayout(cfx.ContentLayout.Near); var divHolder = document.getElementById('ChartDiv'); chart1.create(divHolder); } LoadPieChart(); </script> </body> </html> -
The pie chart apperance differ in Chrome and IE. Below is my source. I can't attach an image on how the chart look because of size limitation. Code with JS: <html> <head> <meta charset="utf-8"> <meta http-equiv="X-UA-Compatible" content="IE=edge"> <title></title> <meta name="viewport" content="width=device-width, initial-scale=1"> <meta name="description" content=""> <style> * { -moz-box-sizing: border-box; -webkit-box-sizing: border-box; box-sizing: border-box; /* Border boxing is used, so the padding, margin and borders are within the width and height of de element. */ color: rgb(112, 112, 112); font-family: Arial; font-size: 11px; margin: 0; /* Margin zero is used to prevent unnecessary white space. */ padding: 0; /* Padding zero is used to prevent unnecessary white space. */ } </style> </head> <body> @RenderBody() </body> <script type="text/javascript" src="~/Scripts/jquery.min.js"></script> <script type="text/javascript" src="~/Scripts/jChartFx/jchartfx.system.js"></script> <script type="text/javascript" src="~/Scripts/jChartFx/jchartfx.coreVector.js"></script> <script type="text/javascript" src="~/Scripts/jChartFx/jchartfx.coreBasic.js"></script> <script type="text/javascript" src="~/Scripts/jChartFx/jchartfx.advanced.js"></script> @* <script type="text/javascript" src="~/Scripts/jChart/jchartfx.userinterface.js"></script> <link rel="stylesheet" type="text/css" href="~/Content/jChart/jchartfx.userinterface.css" /> *@ <link rel="stylesheet" type="text/css" href="~/Stylesheets/jChartfx/Attributes/jchartfx.attributes.css" /> <link rel="stylesheet" type="text/css" href="~/Stylesheets/jChartfx/Palettes/jchartfx.palette.css" /> <script type="text/javascript" language="javascript"> @using System.Web.Script.Serialization; var chart1; function LoadPieChart() { chart1 = new cfx.Chart(); chart1.setGallery(cfx.Gallery.Pie); chart1.getAllSeries().getPointLabels().setVisible(true); var pieAttr = chart1.getAllSeries().getGalleryAttributes(); pieAttr.setLabelsInside(false); chart1.getAllSeries().getPointLabels().setFormat("%l %p%%"); chart1.getLegendBox().setVisible(false); //var str = @Html.Raw(new JavaScriptSerializer().Serialize(ViewData["Asset Allocations Chart"])); var str = @Html.Raw(Json.Encode(ViewData["Asset Allocations Chart"])); @*$.each(@Html.Raw(Json.Encode(ViewData["Asset Allocations Chart"])), function(i, item){ alert(item.AssetTypeCd + "|" + item.AssetType + "|" + item.EndMarketValue); //chart1.setDataSource(item); });*@ chart1.getAxisY().getDataFormat().setDecimals(2); chart1.getView3D().setEnabled(true); chart1.getAllSeries().getPointLabels().setVisible(true); chart1.setDataSource(str); var data = chart1.getData(); data.setSeries(1); data.setPoints(10); chart1.getAllSeries().getPointLabels().setVisible(true); chart1.getAllSeries().getPointLabels().setAlignment(cfx.StringAlignment.NEAR); chart1.getLegendBox().setVisible(false); chart1.getLegendBox().setWidth(50); chart1.getLegendBox().setDock(cfx.DockArea.Right); chart1.getLegendBox().setContentLayout(cfx.ContentLayout.Near); var divHolder = document.getElementById('ChartDiv'); chart1.create(divHolder); } LoadPieChart(); </script> </html> Code: <!DOCTYPE html> <html> <head> <meta charset="utf-8"> <meta http-equiv="X-UA-Compatible" content="IE=edge"> <title></title> <meta name="viewport" content="width=device-width, initial-scale=1"> <meta name="description" content=""> <link href="/Content/bootstrap-theme.css" rel="stylesheet" /> <link href="/Content/bootstrap.css" rel="stylesheet" /> <script type="text/javascript" src="/Scripts/jquery.min.js"></script> <script type="text/javascript" src="/Scripts/bootstrap.js"></script> <link rel="stylesheet" type="text/css" href="/Content/jPushMenu.css" /> </head> <body> <div data-role="layout" data-id="drawer-layout"> <header data-role="header"> <div data-role="navbar" style="height:120px;"> <button class="toggle-menu menu-left push-body" data-align="left" style="height:25px;width:25px; top:80px;color:black;font-size: x-large; background-image:url('../Content/drawer.png'); background-repeat:no-repeat;background-color:transparent; border:none; "></button> <a href="/"> <img src="../Content/SSLogo.gif" height="97" style="position:absolute; left:40px;" /> </a> <span data-role="view-title" style="color: red; font-weight: bold;position: absolute; right:25px; top: 55px; "> <form action="/Account/LogOff" class="navbar-right" id="logoutForm" method="post"><input name="__RequestVerificationToken" type="hidden" value="g00xgeRVdyVdGuCNHWCfwNMgII_JZWTM2tQRpwp34YNbUNojbRzcLyqlEoEy6uHZUqdcrWcejlc_vKsV50KqnCmDmb5NSdwgj_spuUUJMjRkw1MskONadDSZe9ozrfiF-B4-dpOmbvITouNq4dGSyw2" /> <div style="text-align:right"> <a href="/Manage" title="Manage">Hello demouser!</a> <a href="javascript:document.getElementById('logoutForm').submit()"> <img src="/Content/logout.png" height="20" /> Log off </a> </div> </form> </span> </div> </header> <nav class="cbp-spmenu cbp-spmenu-vertical cbp-spmenu-left"> <a href="javascript:document.getElementById('logoutForm').submit()"> <img src="/Content/logout.png" height="20" /> Log off </a> <h3>Menu</h3> <a href="/"> <img src="/Content/images/icons-png/home-black.png" /> Home </a> <h3>Accounts</h3> <a href="/Aggregates">Aggregate</a> <a href="/Positions">Positions</a> <h3>Transactions</h3> <a href="/Transactions/Transactions">Transactions</a> <a href="/Transactions/TransType">Transaction Type</a> <h3>Reporting</h3> <a href="/Aggregates/Performance">Performance Reports</a> <a href="/Bundles">Report Batches</a> <h3>Benchmark</h3> <a href="/Benchmarks/Details">Details</a> <a href="/Benchmarks/Yields">Yields</a> <h3>User Maintenance</h3> <a href="/UserAdministration">User Administration</a> <a href="/Advisors">Investment Reps</a> <h3>My Profile</h3> <a href="/Manage/ChangePassword"> <img src="/Content/images/icons-png/lock-black.png" /> Change Password </a> </nav> </div> <div data-role="view" id="drawer-home" data-layout="drawer-layout" data-title=""> <link href="/Content/jquery-ui.css" rel="stylesheet" /> <script src="/Scripts/jquery-2.1.3.min.js"></script> <script src="/Scripts/jquery-ui.js"></script> <div id="tabs"> <ul class="nav nav-tabs" id="myTab"> <li class="active"> <a data-toggle="tab" href="#home">Home</a> </li> <li><a data-toggle="tab" href="#aggregate">Aggregate</a></li> <li><a data-toggle="tab" href="#account">Account</a></li> <li><a data-toggle="tab" href="#securities">Securities</a></li> </ul> <div id="home" class="tab-pane fade in active"> <iframe width="1000" height="1200" scrolling="yes" frameborder="0" style="border:none;" src="/DashBoard/Home/1"></iframe> </div> <div id="aggregate" class="tab-pane fade in"> <iframe width="1000" height="1200" scrolling="yes" frameborder="0" style="border:none;" src="/DashBoard/Aggregate/2"></iframe> </div> <div id="account" class="tab-pane fade in"> <iframe width="1000" height="1200" scrolling="yes" frameborder="0" style="border:none;" src="/Home/Account"></iframe> </div> <div id="securities" class="tab-pane fade in"> <iframe width="1000" height="1200" scrolling="yes" frameborder="0" style="border:none;" src="/Home/Securities"></iframe> </div> <hr> </div> <script type="text/javascript"> $(document).ready(function () { $("#tabs").tabs(); $("#tabs").tabs("option", "selected", 0); }); </script> </div> <!--load jPushMenu, required--> <script src="/Scripts/jPushMenu.js"></script> <!--call jPushMenu, required--> <script> jQuery(document).ready(function ($) { $('.toggle-menu').jPushMenu(); }); </script> <!-- Visual Studio Browser Link --> <script type="application/json" id="__browserLink_initializationData"> {"appName":"Chrome","requestId":"627be2e2cad74a3c9bd2279eeb97adef"} </script> <script type="text/javascript" src="http://localhost:51968/d18da8fa4f5642658c24c936204c7dfe/browserLink" async="async"></script> <!-- End Browser Link --> </body> </html>
-
Pie chart does not render using Firefox
StatementSolutions replied to StatementSolutions's question in General Questions
I did not notice any errors when I hit f12 and view console -
Pie chart does not render using Firefox
StatementSolutions replied to StatementSolutions's question in General Questions
Page source IE: <!DOCTYPE html> <html> <head> <meta charset="utf-8"> <meta http-equiv="X-UA-Compatible" content="IE=edge"> <title></title> <meta name="viewport" content="width=device-width, initial-scale=1"> <meta name="description" content=""> </head> <body> <div> <div> <div id="columns"> <ul id="column1" class="column" style="width:50%;"> <!DOCTYPE html> <html> <head> <meta charset="utf-8"> <meta http-equiv="X-UA-Compatible" content="IE=edge"> <title></title> <meta name="viewport" content="width=device-width, initial-scale=1"> <meta name="description" content=""> <style> * { -moz-box-sizing: border-box; -webkit-box-sizing: border-box; box-sizing: border-box; /* Border boxing is used, so the padding, margin and borders are within the width and height of de element. */ color: rgb(112, 112, 112); font-family: Arial; font-size: 11px; margin: 0; /* Margin zero is used to prevent unnecessary white space. */ padding: 0; /* Padding zero is used to prevent unnecessary white space. */ } </style> </head> <body> <li class="widget"> <div style="overflow:auto;height:200px;"> <div data-role="navbar" class="widget-head" id="navcontainer"> <h3>Asset Breakdown</h3> <ul> <li> <button id="pinButton" class="submitButton" onclick="Pin('AssetAllocation2')"> <img src="/Content/pin.png" alt="" wdith="15" height="15" /> </button> </li> <li> <button id="resizeButton" class="submitButton" onclick="MaximizeWidget('/Widget/AssetAllocation2')"> <img src="/Content/images/icons-png/plus-black.png" alt="" wdith="15" height="15" /> </button> </li> <li> <button id="rotateButton" class="submitButton" onclick="Refresh('AssetAllocation2')"> <img src="/Content/images/icons-png/refresh-black.png" alt="" wdith="15" height="15" /> </button> </li> </ul> ; </div> <div class="widget-content"> <table class="table table-striped table-hover table-bordered table-condensed"> <tr> <th>Asset Type</th> <th>Market Value</th> <th>Percentage</th> </tr> <tr> <td> Cash & Cash Equivalents </td> <td> $130,452.31 </td> <td> 13.32 % </td> </tr> <tr> <td> Equities </td> <td> $293,277.39 </td> <td> 29.94 % </td> </tr> <tr> <td> Taxable Fixed Income </td> <td> $301,496.17 </td> <td> 30.78 % </td> </tr> <tr> <td> Non Taxable Fixed Income </td> <td> $254,425.70 </td> <td> 25.97 % </td> </tr> <tr> <td> Other Securities </td> <td> $0.00 </td> <td> 0.00 % </td> </tr> </table> </div> </div> </li> <!-- Visual Studio Browser Link --> <script type="application/json" id="__browserLink_initializationData"> {"appName":"Internet Explorer","requestId":"baad894efb60461299ccb7d5557ea220"} </script> <script type="text/javascript" src="http://localhost:59623/3057d34ac1104072a7979daed1877b83/browserLink"async="async"></script> <!-- End Browser Link --> </body> </html> <html> <head> <meta charset="utf-8"> <meta http-equiv="X-UA-Compatible" content="IE=edge"> <title></title> <meta name="viewport" content="width=device-width, initial-scale=1"> <meta name="description" content=""> <style> * { -moz-box-sizing: border-box; -webkit-box-sizing: border-box; box-sizing: border-box; /* Border boxing is used, so the padding, margin and borders are within the width and height of de element. */ color: rgb(112, 112, 112); font-family: Arial; font-size: 11px; margin: 0; /* Margin zero is used to prevent unnecessary white space. */ padding: 0; /* Padding zero is used to prevent unnecessary white space. */ } </style> </head> <body> <li class="widget"> <div style="overflow:auto;height:250px;"> <div data-role="navbar" class="widget-head" id="navcontainer"> <h3>Asset Allocation</h3> <ul> <li> <button id="pinButton" class="submitButton" onclick="Pin('AssetAllocation')"> <img src="/Content/pin.png" alt="" wdith="15" height="15" /> </button> </li> <li> <button id="resizeButton" class="submitButton" onclick="MaximizeWidget('/Widget/AssetAllocation')"> <img src="/Content/images/icons-png/plus-black.png" alt="" wdith="15" height="15" /> </button> </li> <li> <button id="rotateButton" class="submitButton" onclick="Refresh('AssetAllocation')"> <img src="/Content/images/icons-png/refresh-black.png" alt="" wdith="15" height="15" /> </button> </li> </ul> ; </div> <div class="widget-content" id="ChartDiv" style="width:480px;height:230px"></div> </div> </li> </body> <script type="text/javascript" src="/Scripts/jquery.min.js"></script> <script type="text/javascript" src="/Scripts/jChartFx/jchartfx.system.js"></script> <script type="text/javascript" src="/Scripts/jChartFx/jchartfx.coreVector.js"></script> <script type="text/javascript" src="/Scripts/jChartFx/jchartfx.coreBasic.js"></script> <script type="text/javascript" src="/Scripts/jChartFx/jchartfx.advanced.js"></script> <link rel="stylesheet" type="text/css" href="/Stylesheets/jChartfx/Attributes/jchartfx.attributes.css" /> <link rel="stylesheet" type="text/css" href="/Stylesheets/jChartfx/Palettes/jchartfx.palette.css" /> <script type="text/javascript" language="javascript"> var chart1; function LoadPieChart() { chart1 = new cfx.Chart(); chart1.setGallery(cfx.Gallery.Pie); chart1.getAllSeries().getPointLabels().setVisible(true); var pieAttr = chart1.getAllSeries().getGalleryAttributes(); pieAttr.setLabelsInside(false); chart1.getAllSeries().getPointLabels().setFormat("%l %p%%"); chart1.getLegendBox().setVisible(false); //var str = [{"AssetType":"Cash \u0026 Cash Equivalents","AssetTypeCd":"C","EndMarketValue":130452.31,"EndMarketValueRatio":0.133161},{"AssetType":"Equities","AssetTypeCd":"E","EndMarketValue":293277.39,"EndMarketValueRatio":0.299369},{"AssetType":"Taxable\r\nFixed Income","AssetTypeCd":"I","EndMarketValue":301496.17,"EndMarketValueRatio":0.307758},{"AssetType":"Non Taxable\r\nFixed Income","AssetTypeCd":"N","EndMarketValue":254425.70,"EndMarketValueRatio":0.25971},{"AssetType":"Other Securities","AssetTypeCd":"O","EndMarketValue":0.00,"EndMarketValueRatio":0}]; var str = [{"AssetType":"Cash \u0026 Cash Equivalents","AssetTypeCd":"C","EndMarketValue":130452.31,"EndMarketValueRatio":0.133161},{"AssetType":"Equities","AssetTypeCd":"E","EndMarketValue":293277.39,"EndMarketValueRatio":0.299369},{"AssetType":"Taxable\r\nFixed Income","AssetTypeCd":"I","EndMarketValue":301496.17,"EndMarketValueRatio":0.307758},{"AssetType":"Non Taxable\r\nFixed Income","AssetTypeCd":"N","EndMarketValue":254425.70,"EndMarketValueRatio":0.25971},{"AssetType":"Other Securities","AssetTypeCd":"O","EndMarketValue":0.00,"EndMarketValueRatio":0}]; chart1.getAxisY().getDataFormat().setDecimals(2); chart1.getView3D().setEnabled(true); chart1.getAllSeries().getPointLabels().setVisible(true); chart1.setDataSource(str); var data = chart1.getData(); data.setSeries(1); data.setPoints(10); chart1.getAllSeries().getPointLabels().setVisible(true); chart1.getAllSeries().getPointLabels().setAlignment(cfx.StringAlignment.NEAR); chart1.getLegendBox().setVisible(false); chart1.getLegendBox().setWidth(50); chart1.getLegendBox().setDock(cfx.DockArea.Right); chart1.getLegendBox().setContentLayout(cfx.ContentLayout.Near); var divHolder = document.getElementById('ChartDiv'); chart1.create(divHolder); } LoadPieChart(); </script> </html> </ul> <ul id="column2" class="column" style="width:50%;"></ul> </div> </div> </div> </body> </html> <script src="/Scripts/jquery-DragNDrop.js"></script> <script type="text/javascript" src="/scripts/jquery-ui-personalized-1.6rc2.min.js"></script> <script type="text/javascript" src="/scripts/inettuts.js"></script> <link href="/content/inettuts.css" rel="stylesheet" type="text/css" /> Page source Firefox: <!DOCTYPE html> <html> <head> <meta charset="utf-8"> <meta http-equiv="X-UA-Compatible" content="IE=edge"> <title></title> <meta name="viewport" content="width=device-width, initial-scale=1"> <meta name="description" content=""> <link href="/Content/bootstrap-theme.css" rel="stylesheet" /> <link href="/Content/bootstrap.css" rel="stylesheet" /> <script type="text/javascript" src="/Scripts/jquery.min.js"></script> <script type="text/javascript" src="/Scripts/bootstrap.js"></script> <link rel="stylesheet" type="text/css" href="/Content/jPushMenu.css" /> </head> <body> <div data-role="layout" data-id="drawer-layout"> <header data-role="header"> <div data-role="navbar" style="height:120px;"> <button class="toggle-menu menu-left push-body" data-align="left" style="height:25px;width:25px; top:80px;color:black;font-size: x-large; background-image:url('../Content/drawer.png'); background-repeat:no-repeat;background-color:transparent; border:none; "></button> <a href="/"> <img src="../Content/SSLogo.gif" height="97" style="position:absolute; left:40px;" /> </a> <span data-role="view-title" style="color: red; font-weight: bold;position: absolute; right:25px; top: 55px; "> <form action="/Account/LogOff" class="navbar-right" id="logoutForm" method="post"><input name="__RequestVerificationToken" type="hidden" value="IdWSgDtt11oFWm9NqDguQ8cmYymcPp_bckKhWdBBtKdrE_QYjwO2ounvIciXwU8cl23XojDXSzTsgCIlTkkpI6rXQjLP6ma4c7iVIKhyCx9SSpKQXNMMNs7NVnPweZE1uxrAk6sdVjmZe3N2lkJdLA2" /> <div style="text-align:right"> <a href="/Manage" title="Manage">Hello demouser!</a> <a href="javascript:document.getElementById('logoutForm').submit()"> <img src="/Content/logout.png" height="20" /> Log off </a> </div> </form> </span> </div> </header> <nav class="cbp-spmenu cbp-spmenu-vertical cbp-spmenu-left"> <a href="javascript:document.getElementById('logoutForm').submit()"> <img src="/Content/logout.png" height="20" /> Log off </a> <h3>Menu</h3> <a href="/"> <img src="/Content/images/icons-png/home-black.png" /> Home </a> <h3>Accounts</h3> <a href="/Aggregates">Aggregate</a> <a href="/Positions">Positions</a> <h3>Transactions</h3> <a href="/Transactions/Transactions">Transactions</a> <a href="/Transactions/TransType">Transaction Type</a> <h3>Reporting</h3> <a href="/Aggregates/Performance">Performance Reports</a> <a href="/Bundles">Report Batches</a> <h3>Benchmark</h3> <a href="/Benchmarks/Details">Details</a> <a href="/Benchmarks/Yields">Yields</a> <h3>User Maintenance</h3> <a href="/UserAdministration">User Administration</a> <a href="/Advisors">Investment Reps</a> <h3>My Profile</h3> <a href="/Manage/ChangePassword"> <img src="/Content/images/icons-png/lock-black.png" /> Change Password </a> </nav> </div> <div data-role="view" id="drawer-home" data-layout="drawer-layout" data-title=""> <link href="/Content/jquery-ui.css" rel="stylesheet" /> <script src="/Scripts/jquery-2.1.3.min.js"></script> <script src="/Scripts/jquery-ui.js"></script> <div id="tabs"> <ul class="nav nav-tabs" id="myTab"> <li class="active"> <a data-toggle="tab" href="#home">Home</a> </li> <li><a data-toggle="tab" href="#aggregate">Aggregate</a></li> <li><a data-toggle="tab" href="#account">Account</a></li> <li><a data-toggle="tab" href="#securities">Securities</a></li> </ul> <div id="home" class="tab-pane fade in active"> <iframe width="1000" height="1200" scrolling="yes" frameborder="0" style="border:none;" src="/DashBoard/Home/1"></iframe> </div> <div id="aggregate" class="tab-pane fade in"> <iframe width="1000" height="1200" scrolling="yes" frameborder="0" style="border:none;" src="/DashBoard/Aggregate/2"></iframe> </div> <div id="account" class="tab-pane fade in"> <iframe width="1000" height="1200" scrolling="yes" frameborder="0" style="border:none;" src="/Home/Account"></iframe> </div> <div id="securities" class="tab-pane fade in"> <iframe width="1000" height="1200" scrolling="yes" frameborder="0" style="border:none;" src="/Home/Securities"></iframe> </div> <hr> </div> <script type="text/javascript"> $(document).ready(function () { $("#tabs").tabs();$("#tabs").tabs("option", "selected", 0); }); </script> </div> <!--load jPushMenu, required--> <script src="/Scripts/jPushMenu.js"></script> <!--call jPushMenu, required--> <script> jQuery(document).ready(function ($) {$('.toggle-menu').jPushMenu();}); </script> <!-- Visual Studio Browser Link --> <script type="application/json" id="__browserLink_initializationData"> {"appName":"Firefox","requestId":"4da232cf9ec04e468b29838a66adb51f"} </script> <script type="text/javascript" src="http://localhost:59623/3057d34ac1104072a7979daed1877b83/browserLink"async="async"></script> <!-- End Browser Link --> </body> </html> -
Pie chart does not render using Firefox
StatementSolutions replied to StatementSolutions's question in General Questions
This is an MVC application. It renders in IE & Chrome but not in Firefox.: cshtml: <html> <head> <meta charset="utf-8"> <meta http-equiv="X-UA-Compatible" content="IE=edge"> <title></title> <meta name="viewport" content="width=device-width, initial-scale=1"> <meta name="description" content=""> <style> * { -moz-box-sizing: border-box; -webkit-box-sizing: border-box; box-sizing: border-box; /* Border boxing is used, so the padding, margin and borders are within the width and height of de element. */ color: rgb(112, 112, 112); font-family: Arial; font-size: 11px; margin: 0; /* Margin zero is used to prevent unnecessary white space. */ padding: 0; /* Padding zero is used to prevent unnecessary white space. */ } </style> </head> <body> @RenderBody() </body> <script type="text/javascript" src="~/Scripts/jquery.min.js"></script> <script type="text/javascript" src="~/Scripts/jChartFx/jchartfx.system.js"></script> <script type="text/javascript" src="~/Scripts/jChartFx/jchartfx.coreVector.js"></script> <script type="text/javascript" src="~/Scripts/jChartFx/jchartfx.coreBasic.js"></script> <script type="text/javascript" src="~/Scripts/jChartFx/jchartfx.advanced.js"></script> @* <script type="text/javascript" src="~/Scripts/jChart/jchartfx.userinterface.js"></script> <link rel="stylesheet" type="text/css" href="~/Content/jChart/jchartfx.userinterface.css" /> *@ <link rel="stylesheet" type="text/css" href="~/Stylesheets/jChartfx/Attributes/jchartfx.attributes.css" /> <link rel="stylesheet" type="text/css" href="~/Stylesheets/jChartfx/Palettes/jchartfx.palette.css" /> <script type="text/javascript" language="javascript"> @using System.Web.Script.Serialization; var chart1; function LoadPieChart() { chart1 = new cfx.Chart(); chart1.setGallery(cfx.Gallery.Pie); chart1.getAllSeries().getPointLabels().setVisible(true); var pieAttr = chart1.getAllSeries().getGalleryAttributes(); pieAttr.setLabelsInside(false); chart1.getAllSeries().getPointLabels().setFormat("%l %p%%"); chart1.getLegendBox().setVisible(false); //var str = @Html.Raw(new JavaScriptSerializer().Serialize(ViewData["Asset Allocations Chart"])); var str = @Html.Raw(Json.Encode(ViewData["Asset Allocations Chart"])); @*$.each(@Html.Raw(Json.Encode(ViewData["Asset Allocations Chart"])), function(i, item){ alert(item.AssetTypeCd + "|" + item.AssetType + "|" + item.EndMarketValue); //chart1.setDataSource(item); });*@ chart1.getAxisY().getDataFormat().setDecimals(2); chart1.getView3D().setEnabled(true); chart1.getAllSeries().getPointLabels().setVisible(true); chart1.setDataSource(str); var data = chart1.getData(); data.setSeries(1); data.setPoints(10); chart1.getAllSeries().getPointLabels().setVisible(true); chart1.getAllSeries().getPointLabels().setAlignment(cfx.StringAlignment.NEAR); chart1.getLegendBox().setVisible(false); chart1.getLegendBox().setWidth(50); chart1.getLegendBox().setDock(cfx.DockArea.Right); chart1.getLegendBox().setContentLayout(cfx.ContentLayout.Near); var divHolder = document.getElementById('ChartDiv'); chart1.create(divHolder); } LoadPieChart(); </script> </html> -
The chart renders on IE & Chrome but does not render in firefox. What is wrong? Code: @model ePortfolio.Models.WidgetViewModel @{ Layout = "~/Views/Shared/_WidgetEmptyLayout.cshtml"; } <li class="widget"> <div style="overflow:auto;height:250px;"> <div data-role="navbar" class="widget-head" id="navcontainer"> @Html.DisplayFor(model => model, "WidgetHeader"); </div> <div class="widget-content" id="ChartDiv" style="width:485px;height:250px;display:inline-block"></div> </div> </li> <script type="text/javascript" src="~/Scripts/jquery.min.js"></script> <script type="text/javascript" src="~/Scripts/jChartFx/jchartfx.system.js"></script> <script type="text/javascript" src="~/Scripts/jChartFx/jchartfx.coreVector.js"></script> <script type="text/javascript" src="~/Scripts/jChartFx/jchartfx.coreBasic.js"></script> <script type="text/javascript" src="~/Scripts/jChartFx/jchartfx.advanced.js"></script> @*<script type="text/javascript" src="~/Scripts/jChart/jchartfx.userinterface.js"></script> <link rel="stylesheet" type="text/css" href="~/Content/jChart/jchartfx.userinterface.css" />*@ <link rel="stylesheet" type="text/css" href="~/Stylesheets/jChartfx/Attributes/jchartfx.attributes.css" /> <link rel="stylesheet" type="text/css" href="~/Stylesheets/jChartfx/Palettes/jchartfx.palette.css" /> <script type="text/javascript" language="javascript"> @using System.Web.Script.Serialization; var chart1; function LoadChart() { chart1 = new cfx.Chart(); chart1.setGallery(cfx.Gallery.Pie); chart1.getAllSeries().getPointLabels().setVisible(true); var pieAttr = chart1.getAllSeries().getGalleryAttributes(); pieAttr.setLabelsInside(false); chart1.getAllSeries().getPointLabels().setFormat("%l %p%%"); chart1.getLegendBox().setVisible(false); //var str = @Html.Raw(new JavaScriptSerializer().Serialize(ViewData["Asset Allocations Chart"])); var str = @Html.Raw(Json.Encode(ViewData["Asset Allocations Chart"])); @*$.each(@Html.Raw(Json.Encode(ViewData["Asset Allocations Chart"])), function(i, item){ alert(item.AssetTypeCd + "|" + item.AssetType + "|" + item.EndMarketValue); //chart1.setDataSource(item); });*@ chart1.getAxisY().getDataFormat().setDecimals(2); chart1.getView3D().setEnabled(true); chart1.getAllSeries().getPointLabels().setVisible(true); chart1.setDataSource(str); //var fields = chart1.getDataSourceSettings().getFields(); //var field1 = new cfx.FieldMap(); //field1.setName("AssetType"); //field1.setUsage(cfx.FieldUsage.RowHeading); //fields.add(field1); //var field2 = new cfx.FieldMap(); //field2.setName("EndMarketValue"); //field2.setUsage(cfx.FieldUsage.ColumnHeading); //fields.add(field2); //var crosstab = new cfx.data.CrosstabDataProvider(); //crosstab.setDataSource(str); //chart1.setDataSource(str); //var data = chartStats.getData(); var data = chart1.getData(); data.setSeries(1); //data.setPoints(10); //var labels = chart1.getAxisX().getLabels(); //labels.clear(); //labels.setItem(0, "Cash & Cash Equivalents"); //labels.setItem(1, "Equities"); //labels.setItem(2, "Taxable Fixed Income"); //labels.setItem(3, "Non Taxable Fixed Income"); //labels.setItem(4, "Other Securities"); //var titles = chart1.getTitles(); //var title = new cfx.TitleDockable(); //title.setText("Asset Allocation"); //titles.add(title); //chart1.getAllSeries().getPointLabels().setFormat("%v"); chart1.getAllSeries().getPointLabels().setVisible(true); chart1.getAllSeries().getPointLabels().setAlignment(cfx.StringAlignment.NEAR); chart1.getLegendBox().setVisible(false); chart1.getLegendBox().setWidth(50); chart1.getLegendBox().setDock(cfx.DockArea.Right); chart1.getLegendBox().setContentLayout(cfx.ContentLayout.Near); var divHolder = document.getElementById('ChartDiv'); chart1.create(divHolder); } LoadChart(); </script>
-
jChartFx using JQuery with Visual Studio
StatementSolutions replied to StatementSolutions's question in jQuery/jQuery UI
- The chart renders on IE & Chrome but doe not in firefox. What is wrong with this? - The chart size differs from IE and Chrome. How can I make the chart size identical no matter what browser used code: @model ePortfolio.Models.WidgetViewModel @{ Layout = "~/Views/Shared/_ChartWidgetEmptyLayout.cshtml"; } <script src="~/Scripts/LoadChart.js"></script> <li class="widget"> <div style="overflow:auto;height:250px;"> <div data-role="navbar" class="widget-head" id="navcontainer"> @Html.DisplayFor(model => model, "WidgetHeader"); </div> <div class="widget-content" id="ChartDiv" style="width:485px;height:250px;display:inline-block"></div> </div> </li> <html> <head> <meta charset="utf-8"> <meta http-equiv="X-UA-Compatible" content="IE=edge"> <title></title> <meta name="viewport" content="width=device-width, initial-scale=1"> <meta name="description" content=""> <style> * { -moz-box-sizing: border-box; -webkit-box-sizing: border-box; box-sizing: border-box; /* Border boxing is used, so the padding, margin and borders are within the width and height of de element. */ color: rgb(112, 112, 112); font-family: Arial; font-size: 11px; margin: 0; /* Margin zero is used to prevent unnecessary white space. */ padding: 0; /* Padding zero is used to prevent unnecessary white space. */ } </style> </head> <body> @RenderBody() </body> <script type="text/javascript" src="~/Scripts/jquery.min.js"></script> <script type="text/javascript" src="~/Scripts/jChartFx/jchartfx.system.js"></script> <script type="text/javascript" src="~/Scripts/jChartFx/jchartfx.coreVector.js"></script> <script type="text/javascript" src="~/Scripts/jChartFx/jchartfx.coreBasic.js"></script> <script type="text/javascript" src="~/Scripts/jChartFx/jchartfx.advanced.js"></script> @*<script type="text/javascript" src="~/Scripts/jChart/jchartfx.userinterface.js"></script> <link rel="stylesheet" type="text/css" href="~/Content/jChart/jchartfx.userinterface.css" />*@ <link rel="stylesheet" type="text/css" href="~/Stylesheets/jChartfx/Attributes/jchartfx.attributes.css" /> <link rel="stylesheet" type="text/css" href="~/Stylesheets/jChartfx/Palettes/jchartfx.palette.css" /> <script src="~/Scripts/LoadChart.js"></script> <script type="text/javascript" language="javascript"> @using System.Web.Script.Serialization; var chart1; function LoadPieChart() { chart1 = new cfx.Chart(); chart1.setGallery(cfx.Gallery.Pie); chart1.getAllSeries().getPointLabels().setVisible(true); var pieAttr = chart1.getAllSeries().getGalleryAttributes(); pieAttr.setLabelsInside(false); chart1.getAllSeries().getPointLabels().setFormat("%l %p%%"); chart1.getLegendBox().setVisible(false); //var str = @Html.Raw(new JavaScriptSerializer().Serialize(ViewData["Asset Allocations Chart"])); var str = @Html.Raw(Json.Encode(ViewData["Asset Allocations Chart"])); @*$.each(@Html.Raw(Json.Encode(ViewData["Asset Allocations Chart"])), function(i, item){ alert(item.AssetTypeCd + "|" + item.AssetType + "|" + item.EndMarketValue); //chart1.setDataSource(item); });*@ chart1.getAxisY().getDataFormat().setDecimals(2); chart1.getView3D().setEnabled(true); chart1.getAllSeries().getPointLabels().setVisible(true); chart1.setDataSource(str); var data = chart1.getData(); data.setSeries(1); data.setPoints(10); //var labels = chart1.getAxisX().getLabels(); //labels.clear(); //labels.setItem(0, "Cash & Cash Equivalents"); //labels.setItem(1, "Equities"); //labels.setItem(2, "Taxable Fixed Income"); //labels.setItem(3, "Non Taxable Fixed Income"); //labels.setItem(4, "Other Securities"); //var titles = chart1.getTitles(); //var title = new cfx.TitleDockable(); //title.setText("Asset Allocation"); //titles.add(title); //chart1.getAllSeries().getPointLabels().setFormat("%v"); chart1.getAllSeries().getPointLabels().setVisible(true); chart1.getAllSeries().getPointLabels().setAlignment(cfx.StringAlignment.NEAR); chart1.getLegendBox().setVisible(false); chart1.getLegendBox().setWidth(50); chart1.getLegendBox().setDock(cfx.DockArea.Right); chart1.getLegendBox().setContentLayout(cfx.ContentLayout.Near); var divHolder = document.getElementById('ChartDiv'); chart1.create(divHolder); } LoadPieChart(); </script> </html>
-
jChartFx using JQuery with Visual Studio
StatementSolutions replied to StatementSolutions's question in jQuery/jQuery UI
The chart renders on IE & Chrome but does not render in firefox. What is wrong? Code: @model ePortfolio.Models.WidgetViewModel @{ Layout = "~/Views/Shared/_WidgetEmptyLayout.cshtml"; } <li class="widget"> <div style="overflow:auto;height:250px;"> <div data-role="navbar" class="widget-head" id="navcontainer"> @Html.DisplayFor(model => model, "WidgetHeader"); </div> <div class="widget-content" id="ChartDiv" style="width:485px;height:250px;display:inline-block"></div> </div> </li> <script type="text/javascript" src="~/Scripts/jquery.min.js"></script> <script type="text/javascript" src="~/Scripts/jChartFx/jchartfx.system.js"></script> <script type="text/javascript" src="~/Scripts/jChartFx/jchartfx.coreVector.js"></script> <script type="text/javascript" src="~/Scripts/jChartFx/jchartfx.coreBasic.js"></script> <script type="text/javascript" src="~/Scripts/jChartFx/jchartfx.advanced.js"></script> @*<script type="text/javascript" src="~/Scripts/jChart/jchartfx.userinterface.js"></script> <link rel="stylesheet" type="text/css" href="~/Content/jChart/jchartfx.userinterface.css" />*@ <link rel="stylesheet" type="text/css" href="~/Stylesheets/jChartfx/Attributes/jchartfx.attributes.css" /> <link rel="stylesheet" type="text/css" href="~/Stylesheets/jChartfx/Palettes/jchartfx.palette.css" /> <script type="text/javascript" language="javascript"> @using System.Web.Script.Serialization; var chart1; function LoadChart() { chart1 = new cfx.Chart(); chart1.setGallery(cfx.Gallery.Pie); chart1.getAllSeries().getPointLabels().setVisible(true); var pieAttr = chart1.getAllSeries().getGalleryAttributes(); pieAttr.setLabelsInside(false); chart1.getAllSeries().getPointLabels().setFormat("%l %p%%"); chart1.getLegendBox().setVisible(false); //var str = @Html.Raw(new JavaScriptSerializer().Serialize(ViewData["Asset Allocations Chart"])); var str = @Html.Raw(Json.Encode(ViewData["Asset Allocations Chart"])); @*$.each(@Html.Raw(Json.Encode(ViewData["Asset Allocations Chart"])), function(i, item){ alert(item.AssetTypeCd + "|" + item.AssetType + "|" + item.EndMarketValue); //chart1.setDataSource(item); });*@ chart1.getAxisY().getDataFormat().setDecimals(2); chart1.getView3D().setEnabled(true); chart1.getAllSeries().getPointLabels().setVisible(true); chart1.setDataSource(str); //var fields = chart1.getDataSourceSettings().getFields(); //var field1 = new cfx.FieldMap(); //field1.setName("AssetType"); //field1.setUsage(cfx.FieldUsage.RowHeading); //fields.add(field1); //var field2 = new cfx.FieldMap(); //field2.setName("EndMarketValue"); //field2.setUsage(cfx.FieldUsage.ColumnHeading); //fields.add(field2); //var crosstab = new cfx.data.CrosstabDataProvider(); //crosstab.setDataSource(str); //chart1.setDataSource(str); //var data = chartStats.getData(); var data = chart1.getData(); data.setSeries(1); //data.setPoints(10); //var labels = chart1.getAxisX().getLabels(); //labels.clear(); //labels.setItem(0, "Cash & Cash Equivalents"); //labels.setItem(1, "Equities"); //labels.setItem(2, "Taxable Fixed Income"); //labels.setItem(3, "Non Taxable Fixed Income"); //labels.setItem(4, "Other Securities"); //var titles = chart1.getTitles(); //var title = new cfx.TitleDockable(); //title.setText("Asset Allocation"); //titles.add(title); //chart1.getAllSeries().getPointLabels().setFormat("%v"); chart1.getAllSeries().getPointLabels().setVisible(true); chart1.getAllSeries().getPointLabels().setAlignment(cfx.StringAlignment.NEAR); chart1.getLegendBox().setVisible(false); chart1.getLegendBox().setWidth(50); chart1.getLegendBox().setDock(cfx.DockArea.Right); chart1.getLegendBox().setContentLayout(cfx.ContentLayout.Near); var divHolder = document.getElementById('ChartDiv'); chart1.create(divHolder); } LoadChart(); </script>